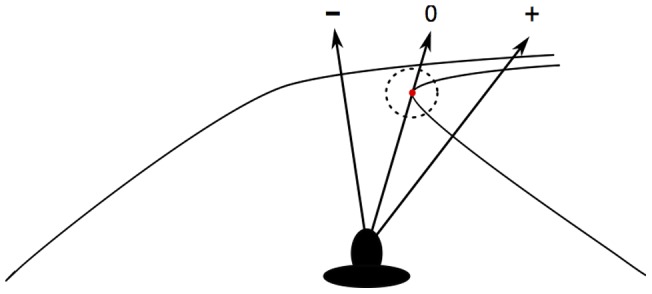
Figure 1. Schematic representation of data analysis methods.

The TP (red dot), the 5° area around the TP (dotted circle) and the sign convention for the horizontal gaze deviations from the TP (arrows) are represented.

The TP (red dot), the 5° area around the TP (dotted circle) and the sign convention for the horizontal gaze deviations from the TP (arrows) are represented.