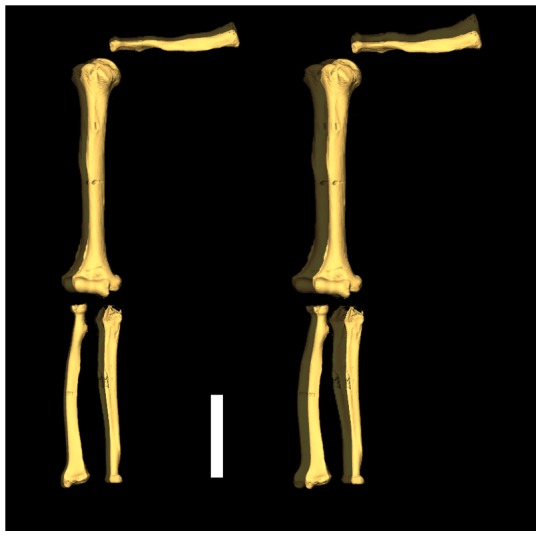
Figure 2. Microtomographic-based 3D reconstruction of the right upper limb chain of Regourdou 1 (in anterior view) showing the average degree of bilateral asymmetry (in %) assessed for the cortical area (CA, left) and the polar second moment of area (J, right) and rendered by virtual superimposition (semi-transparency, in gray) to the original outline of each element (in gold).

To emphasize differences among the different elements, the amount of original asymmetry has been doubled. Scale bar is 10 cm.
