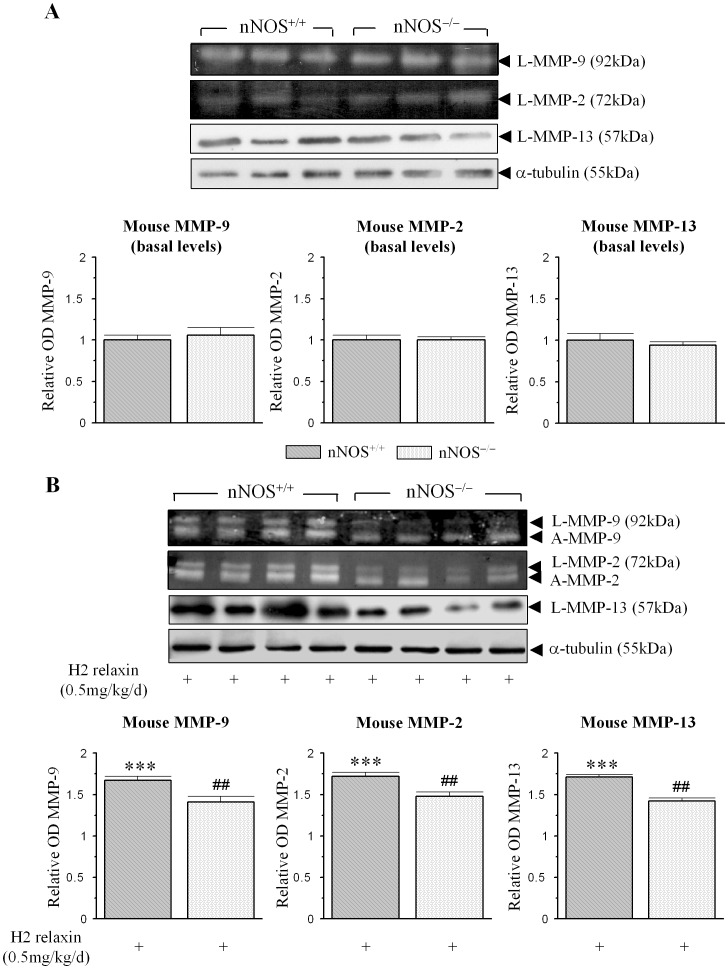
Figure 5. nNOS is required for the MMP-stimulating actions of relaxin in vivo.
(A) Representative gelatin zymographs and Western blots of basal MMP-9, MMP-2 and MMP-13 levels from untreated nNOS+/+ and nNOS−/− mice. (B) Representative zymographs and Western blots of L-MMP-9, A-MMP-9, L-MMP-2, A-MMP-2 and L-MMP-13 from kidney tissues of nNOS+/+ and nNOS−/− mice, treated with H2 relaxin (0.5 mg/kg/day) for 7 days. Additional blots of α-tubulin (A,B) demonstrate the quality and equivalent loading of protein samples. Also shown are the mean ± SE levels of each MMP studied (A,B) (which was derived from the latent and active forms) from untreated vs H2 relaxin-treated animals; as determined by densitometry scanning (from the 3–4 samples per group analysed); and expressed relative to basal levels of each MMP analysed from the untreated nNOS+/+ group, which was expressed as 1 in each case. **p<0.01 vs corresponding basal levels from nNOS+/+ mice; #p<0.05 vs corresponding values from H2 relaxin-treated nNOS+/+ mice.

