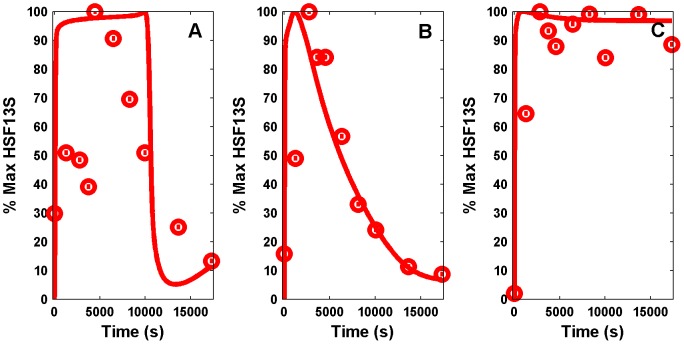
Figure 2. Simulated and experimental time series of heat-shock factor 1 (HSF1) trimer.
In the experiments [24], the time courses of HSF levels were obtained for three different temperatures, namely,  ,
,  , and
, and  , shown in red circles in (A), (B), and (C), respectively. For a very high temperature (
 ), HSF levels reach a new steady state. Fitted time series of HSF13S levels (continuous line) are shown for three different
  that correspond to the stress values of (A) 0.4136, (B) 0.9859, and (C) 1.2066. The percent conversion of the time series is calculated as
  , for all the dynamical variables, and Y is both experimental and simulated time series.

