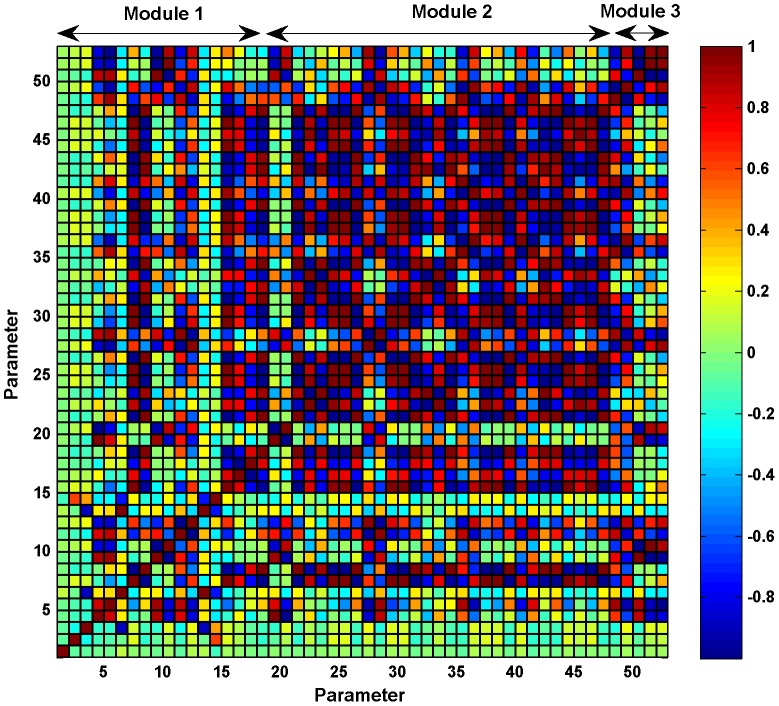
Figure 6. Correlation matrix for the 53 estimated parameters.
The correlation matrix shows a strong positive correlation (+1) or a strong negative correlation (−1) between several sets of parameters indicating that the effect of one parameter can be compensated by a change in the strongly correlated parameter. This points to the same direction as that of the sensitivity analysis, emphasizing the need for more experimental data of intermediate species to uniquely identify the values of the parameters.

