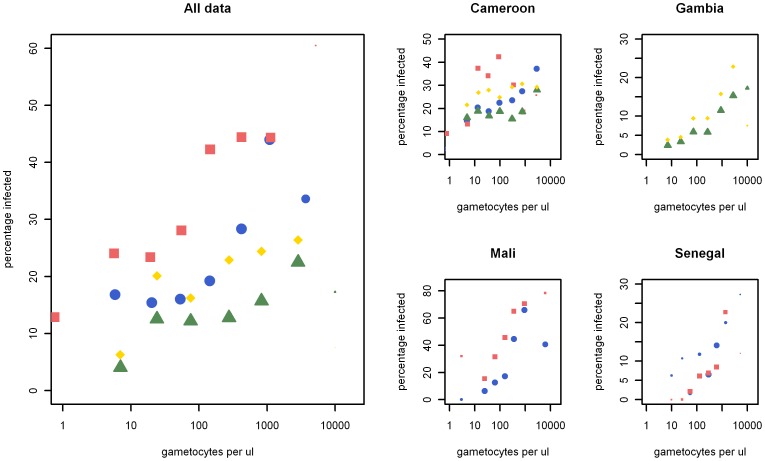
Figure 7. The association between gametocyte density and mosquito infection rates for different feeding conditions.
Plotted is the association between gametocyte density and mosquito infection rates (oocyst prevalence) for skin feeding assays (red squares), whole blood membrane feeding assays (blue circles) and serum replacement experiments with own plasma (green triangles) and control serum (yellow diamonds). Data were grouped according to gametocyte density estimates into 8 equally sized bins (on a log scale). Panel A shows all the data grouped together whilst B to E show the data grouped by country. The size of the data points is relative to the number of mosquitoes dissected in each bin.

