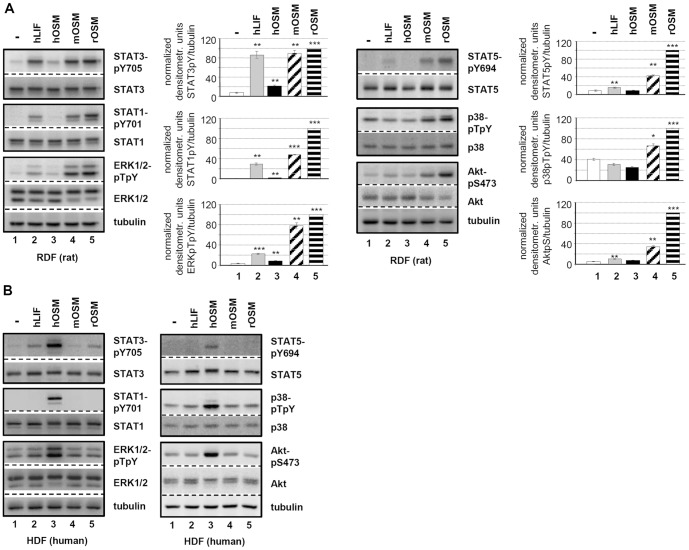
Figure 2. Comparison of hLIF, hOSM, mOSM and rOSM activated signaling pathways in primary dermal fibroblasts.
A, Rat dermal fibroblasts (RDF) and B, human dermal fibroblasts (HDF) were treated with 10 ng/ml hLIF, hOSM, mOSM or rOSM for 15 min. The phosphorylation levels of STAT1, STAT3, ERK1/2 as well as STAT5, p38 and Akt were detected via Western blot analysis. The blots were stripped and reprobed with antibodies recognizing the proteins irrespective of their activation status. Additionally an α-tubulin loading control was included. Phosphorylation intensities were quantified by chemiluminescence analysis and normalized to tubulin. Activation determined for rOSM was set to 100%. Shown are the means (n = 3) with standard error of mean (SEM). * p<0.05, ** p<0.01, *** p<0.001 untreated vs. cytokine-treated sample.

