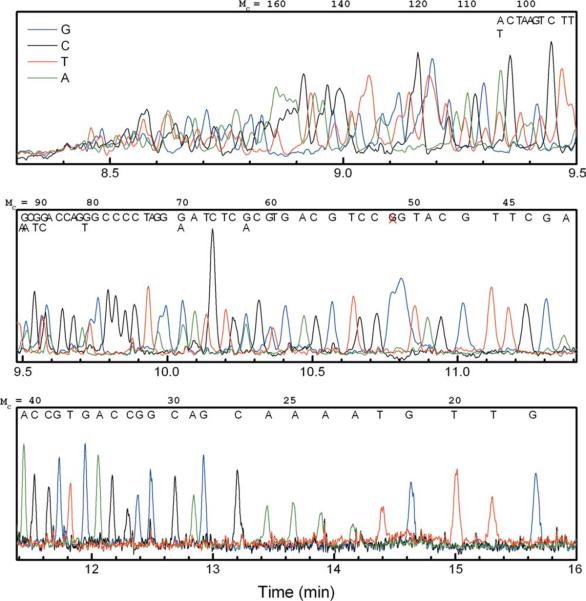
FIGURE 1.
Four-color sequencing electropherogram obtained with 70mer branched drag-tag, with manual base calls of the M13mp18 sequence. The DNA fragment sizes (Mc) are shown at the top of each panel, and a red “X” around Mc = 52 bases marks an unexpected “G” peak. For the purposes of presentation, the “C” and “T” signals have been scaled by a factor of 2 to give peak heights comparable to the “G” and “C” traces, and the data has been smoothed to reduce the high-frequency noise attributed to a small bubble in the fluid path.

