
FIGURE 2.
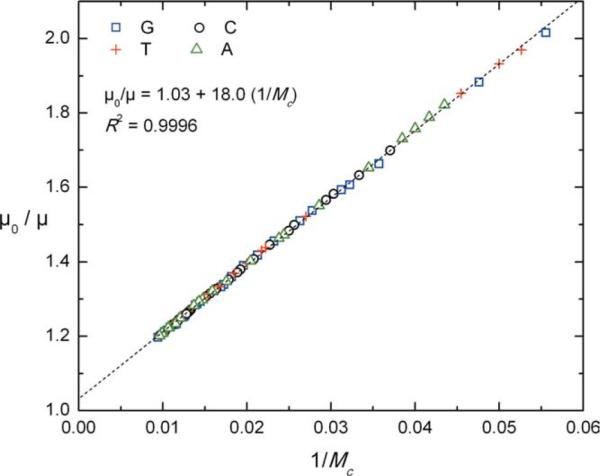
A fit of experimentally measured mobilities (μ0/μ) versus DNA fragment size 1/Mc, according to a rearranged version of Eq. (1), with a slope of α = 18.0 for the octamer-branched drag-tag. Different symbols are used to represent fragments with G, C, A, or T terminations, which reveal no terminator-specific deviation from model behavior.