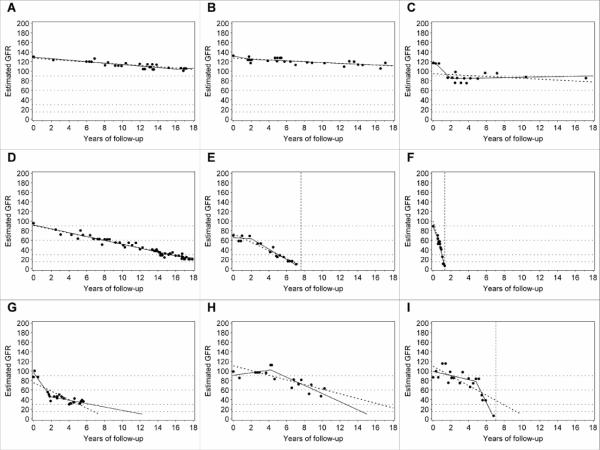
Figure 1.
Patterns of renal function decline: A, B Linear trajectories, stable renal function; C Stable renal function, clinically inconsequential non-linear trajectory; D and F Linear decliners; E Decliner with clinically inconsequential non-linear trajectory (observed time of ESRD is within 1 year from time of reaching eGFR=10 under linear model); G–I Non-linear decline; G Deceleration; H New-onset decline (acceleration); I Acceleration. Dots represent single eGFR measurements and solid lines represent linear spline function. Dotted line represents linear regression. Vertical dotted lines mark the observed time of ESRD onset.

