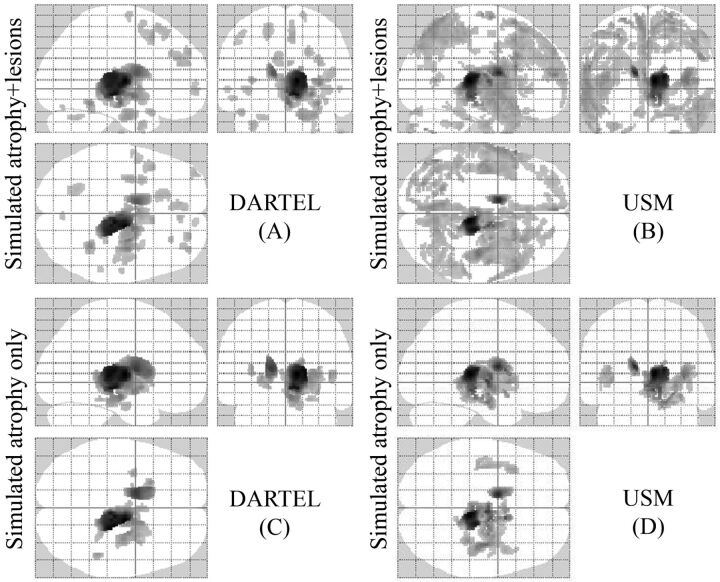
Fig 2.
Regions of GM atrophy by using simulated ground truth data (A–D). Comparisons based on all methods are illustrated. Sixteen normal brain T1-weighted images were used as a control group and were compared with 2 groups of simulated patients (P < .05, corrected for multiple comparisons by using false discovery rate, cluster size >20). The results are displayed on a 3D glass brain. In 1 group (C and D), we only simulated atrophy of the thalamus and caudate, and in the other (A and B), we simulated atrophy in the same regions and added artificial lesions. DARTEL in the presence of only atrophy (C) yielded the most accurate results, detecting the atrophy under the ground truth and reducing the number of FPs compared with USM (D). The presence of lesions increased the number of FP errors in both DARTEL and USM (A and B). See “Materials and Methods” and “Results” section for more details.

