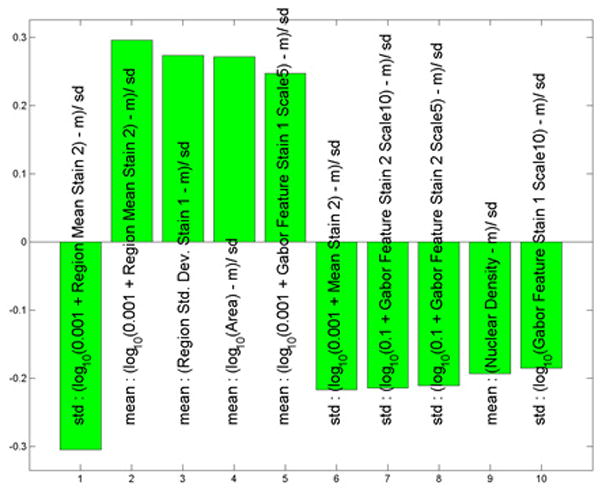
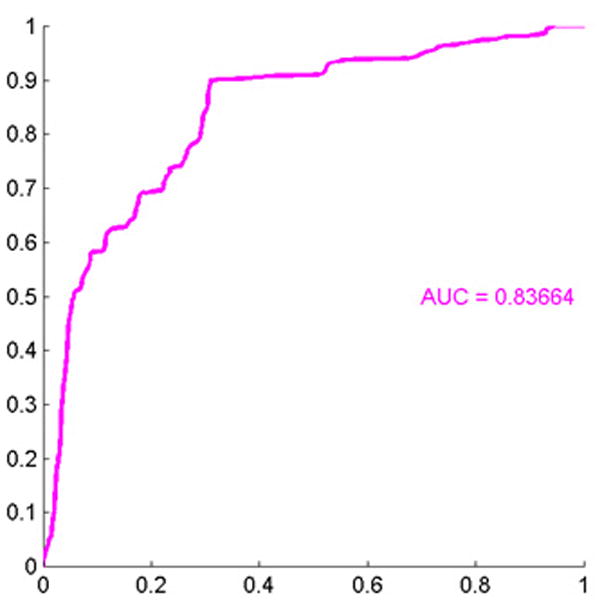
Figure 5.


(A) These features were most useful in driving the separation of severely dysplastic nevi from other types of nevi. While the name provided on the bar also indicates statistical transformation, the top four features represent differences in the standard deviation of calculated whole cell eosin staining intensities (calculated whole cell called region and staining differences are less in severely dysplastic nevi than in others others), average eosin staining intensities, average standard deviation of hematoxylin nuclear staining in each nuclei (calculated nuclei is called area) and mean nuclear area. (B) Area under the receiver operator characteristics (ROC) curve of 0.84, p < 0.0001.
