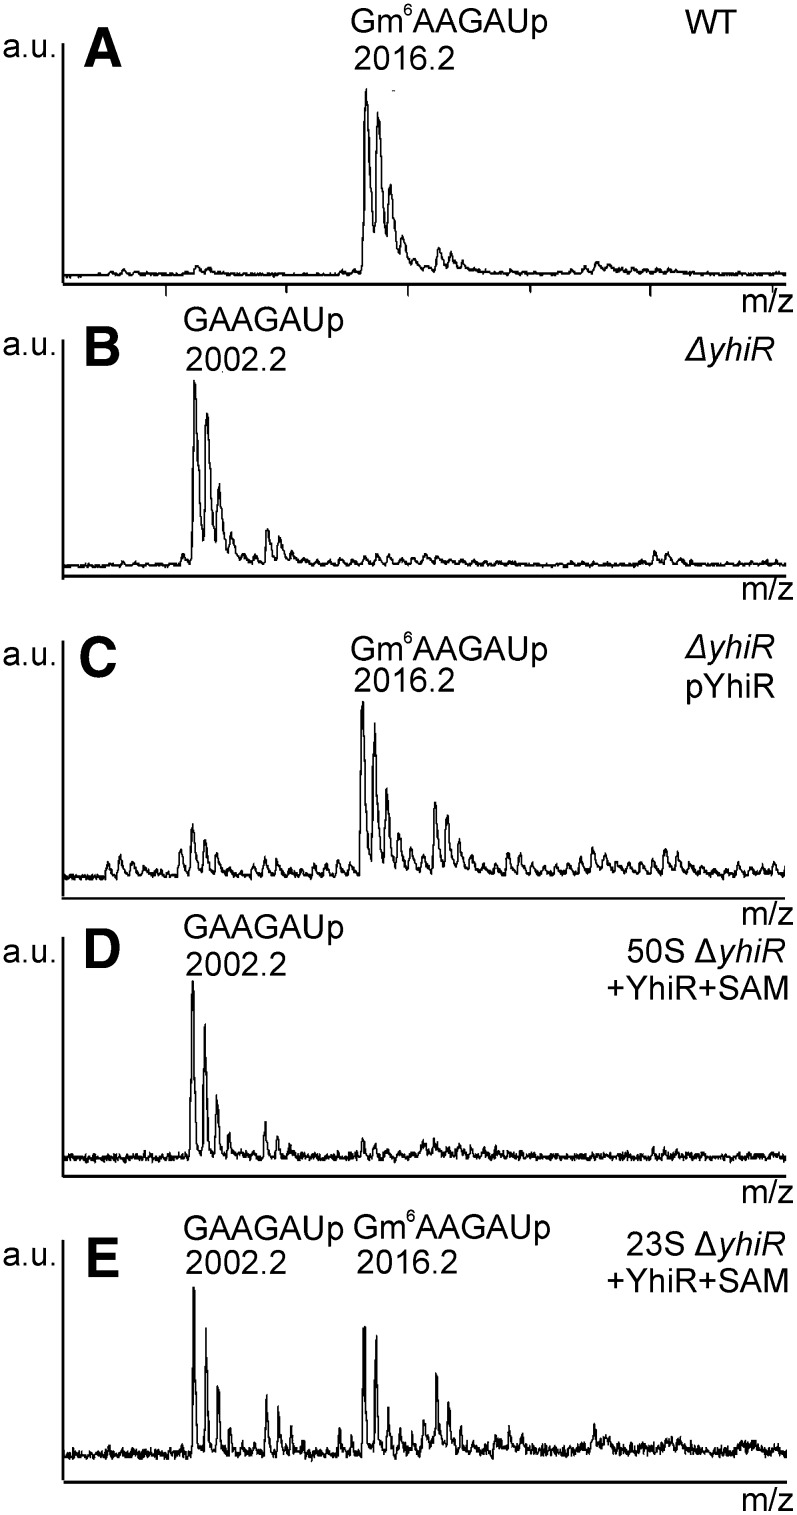
FIGURE 3.
MALDI MS analysis of the RNase A digest of the 23S rRNA fragment's 2017–2053 nt. The part of spectrum around mass/charge (m/z) 1990–2050 is shown. MALDI spectra correspond to fragments of the 23S from the (A) wild-type strain; (B) ΔyhiR strain; (C) ΔyhiR strain, transformed with pCA24YhiR; (D) 50S subunits from the ΔyhiR strain, treated with SAM and recombinant YhiR in vitro; and (E) deproteinized 23S rRNA from the ΔyhiR strain, treated with SAM and recombinant YhiR in vitro. Oligonucleotides corresponding to peaks are indicated.

