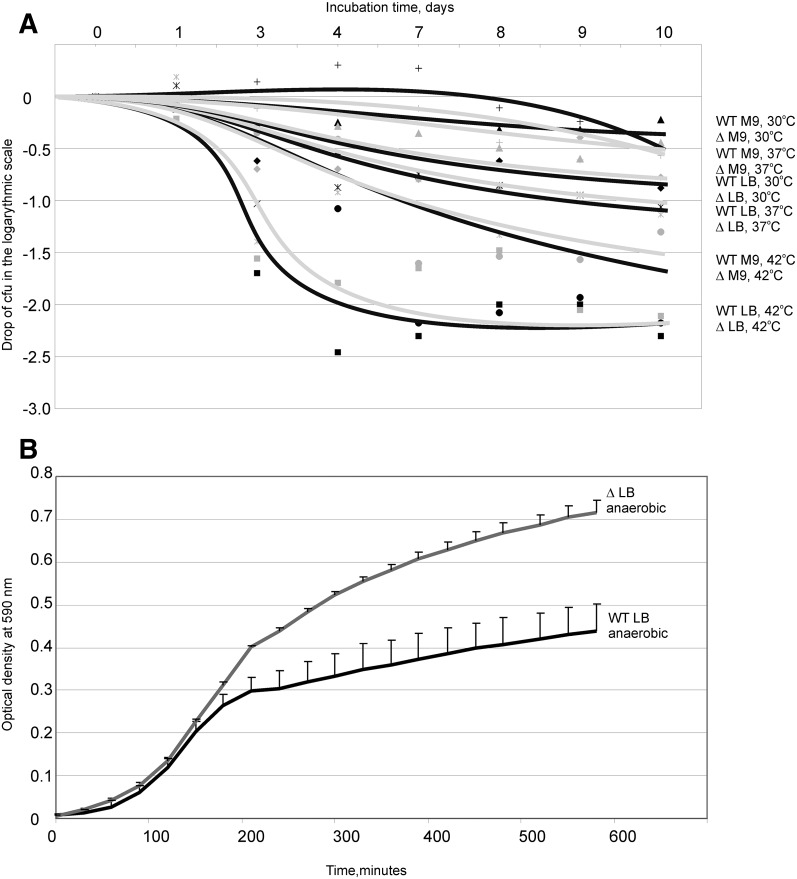
FIGURE 4.
(A) Cell titer drop in the logarithmic scale after incubation of bacterial cultures over time. Data points and approximation curves for the wild-type strain are shown in black, while those for the ΔyhiR strain are shown in gray. Squares correspond to incubation in LB at 42°C. Stars correspond to incubation in LB at 37°C. Diamonds correspond to incubation in LB at 30°C. Circles correspond to incubation in M9 at 42°C. Crosses correspond to incubation in M9 at 37°C. Triangles correspond to incubation in M9 at 30°C. Additionally, incubation conditions are indicated on the right side of the figure at the ends of the corresponding approximation curves. (B) Growth of the wild-type strain (black curve) and the ΔyhiR strain (gray curve) at anaerobic conditions. Error bars, SDs from an average of five independently grown cultures.

