Figure 2.

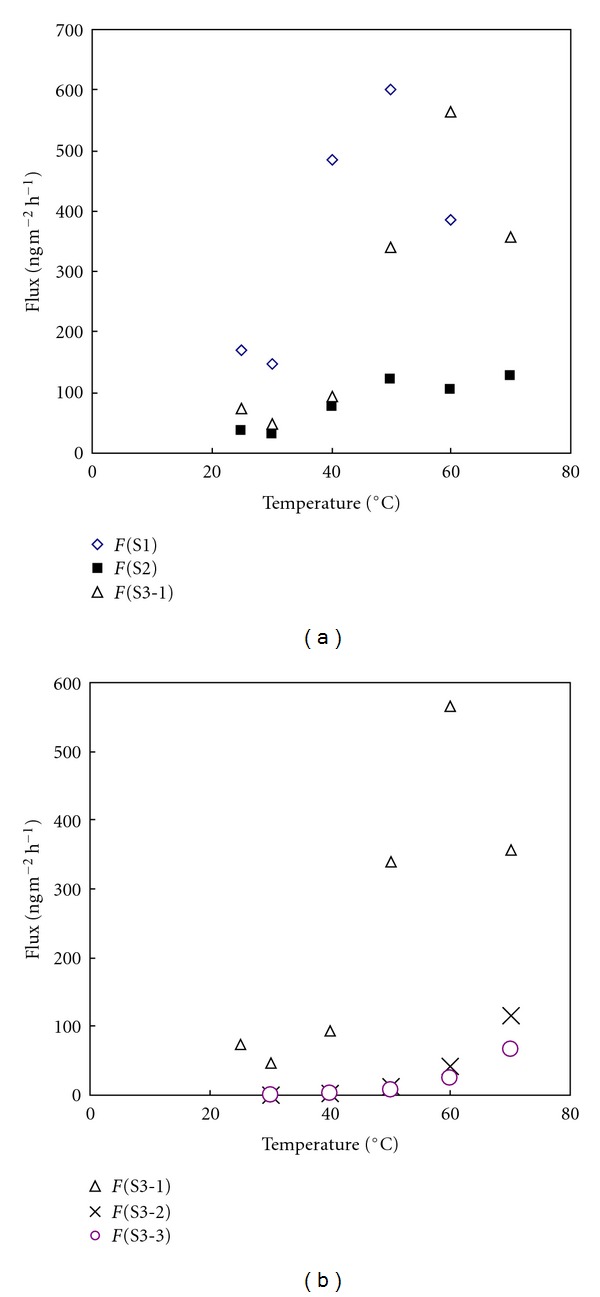
Relationship between temperature and Hg flux (ng m−2 h−1) from 100 g soil samples: (a) Hg flux values derived from the initial run of three samples (upper) and (b) Hg flux values derived from the repetitive runs of S3 sample.

Relationship between temperature and Hg flux (ng m−2 h−1) from 100 g soil samples: (a) Hg flux values derived from the initial run of three samples (upper) and (b) Hg flux values derived from the repetitive runs of S3 sample.