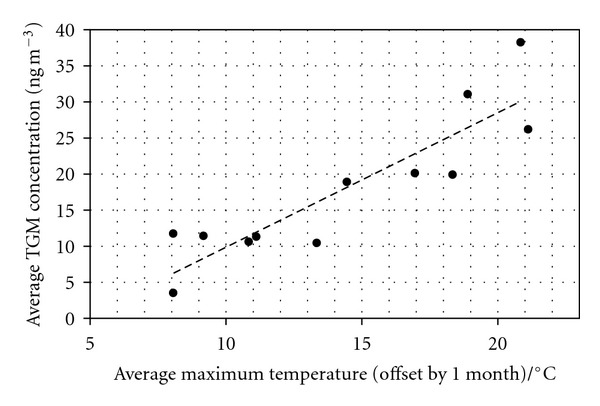
Figure 3.

The average maximum monthly temperature (offset by one month to allow for the lag in the ground warming and cooling) against the average monthly total gaseous mercury concentration recorded at the UK Heavy Metals Monitoring Air Quality Network station at Runcorn during 2010. The best linear fit to the data is shown (R 2 = 0.8) as the dotted line.
