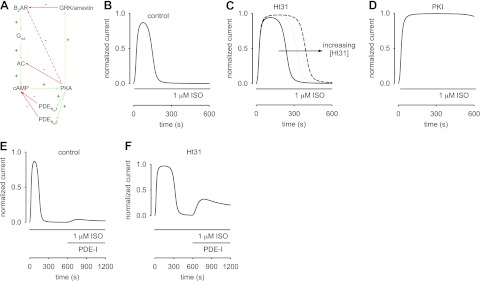
Figure 5.
Mathematical modeling of β2AR-mediated cAMP signaling in ASM cells. A) Schematic of β2AR signaling pathway. Ligand binding to β2ARs triggers activation of Gαs, subsequent activation of AC, and increased cAMP production. Increased cAMP levels activate PKA, which in turn phosphorylates AC and both low- and high-affinity PDEs. Phosphorylation triggers a reduction in AC activity and an increase in both PDE activities. GRK-mediated desensitization lowers β2AR activity. It is likely that PKA activity triggers β2AR desensitization, and it may also trigger increased GRK activity (dashed arrows). The latter reactions are not described in the models, because their effects are not readily distinguished from PKA-mediated inhibition of AC activity. Red lines indicate inhibitory reactions; green lines indicate stimulatory reactions. B–F) Simulations of cAMP-mediated CNG channel activity. B) Simulated response of an ASM cell to 1 μM ISO. CNG channel response is similar to the response depicted in Fig. 3A. C) Simulated response to 1 μM ISO with 10 μM Ht31 in the patch pipette. Solid, dotted, and dashed lines represent simulations in which there is a 2-fold, 3-fold, and 5-fold reduction in local PKA activity, respectively. Based on these simulations, we estimate that 10 μM Ht31 causes a 2- to 3-fold reduction in local PKA activity. D) Simulated response to 1 μM ISO with 20 nM PKI in the patch pipette. The presence of 20 nM PKI causes a marked increase in cAMP accumulation and saturation of the CNG channel response. E, F) ISO was present throughout the simulation, and PDE inhibitors (PDE-I) were at concentrations 10-fold KI. E) In the control condition, PDE-I induced small currents through CNG channels. F) However, when the local PKA activity was reduced 3-fold (analogous to including Ht31 in the patch pipette), PDE-I caused a substantial cAMP-mediated increase in currents through CNG channels. In this model, the peak of the PDE-I induced currents is primarily dictated by the level of GRK activity. These simulations describe the experimental data presented in Fig. 4. Parameter values used to describe near-membrane cAMP signals: [βtot], total β2AR concentration, 1.4 μM; ACsyn, stimulated cAMP synthesis rate, 15 nM/s; Vmax1-PDE and Vmax2-PDE, maximal hydrolysis rate of unphosphorylated high- and low-affinity PDEs, 50 nM/s, Vmax1-PDEp and Vmax2-PDEp, maximal hydrolysis rate of phosphorylated high- and low-affinity PDEs, 150 nM/s, Km1 and Km2, Michaelis constants for high- and low-affinity PDEs, 0.2 and 2.0 μM; kPKA, rate constant of PKA-mediated phosphorylation, 0.01 μM−1 · s−1; kppAC, rate constant of AC dephosphorylation, 0.0005 s−1; kppPDE, rate constant of PDE dephosphorylation, 0.005 s−1. Parameters were manually fit to data. Other model parameters are as described in refs. 3 4 and the references therein.

