Figure 2.

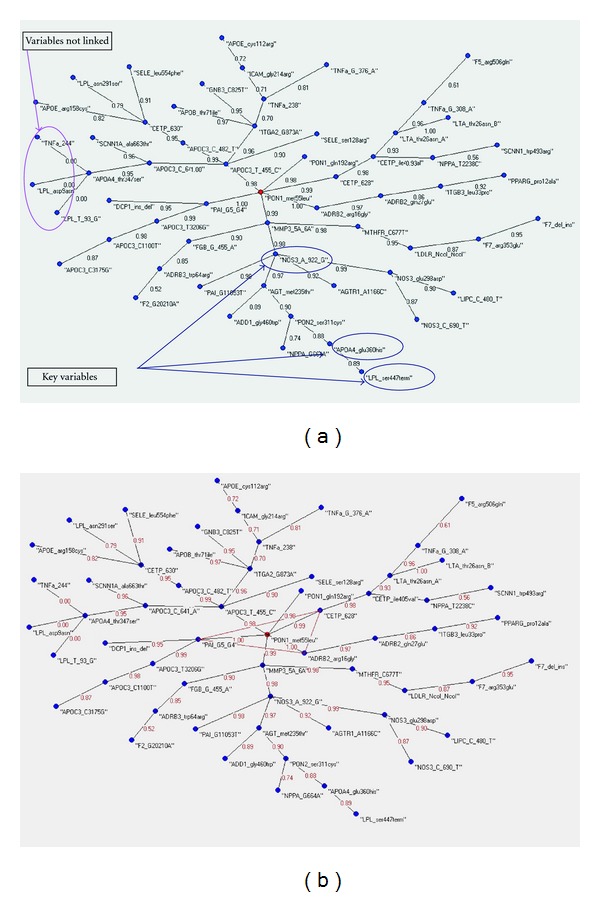
(a) The MST of the cases databest. Into the blue circles the key variables of the graph. (b) The MST of the controls databest. Into the red circles the key variables of the graph.

(a) The MST of the cases databest. Into the blue circles the key variables of the graph. (b) The MST of the controls databest. Into the red circles the key variables of the graph.