
Figure 5.
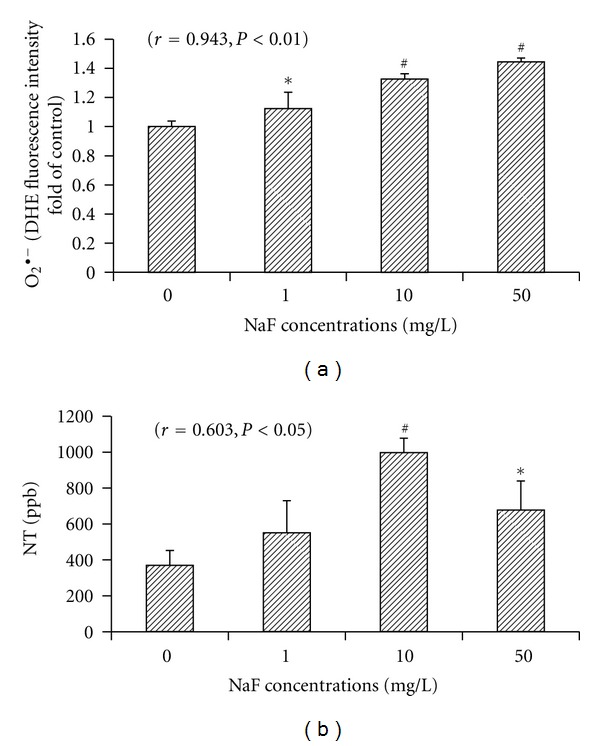
Effects of fluoride on O2 ∙− production (a) and NT concentrations (b) in microglial BV-2 cells. BV-2cells were treated with various concentrations of NaF (1, 10, and 50 mg/L) for a 24 h incubation period, and DHE fluorescence intensity was measured by flow cytometry for O2 ∙− content and DHE fluorescence intensity fold of control was analyzed. Intracellular NT concentrations were measured by ELISA. Bars were presented as mean ± SD. *P < 0.05 and # P < 0.01 compared to the control group.