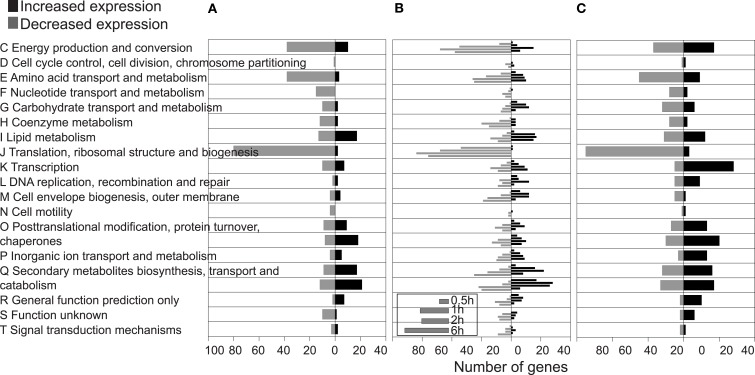
Figure 2.
Proportional abundances of differentially expressed genes in conditions of DBF exposure compared to PHE, categorized per COG. (A) Short exposure to DBF in PHE-grown batch cultures, (B), transient exposure to DBF in chemostats, and (C) growth on DBF in batch culture. Note that (B) shows data sets from the four time points after addition of DBF to the chemostat (see inset).

