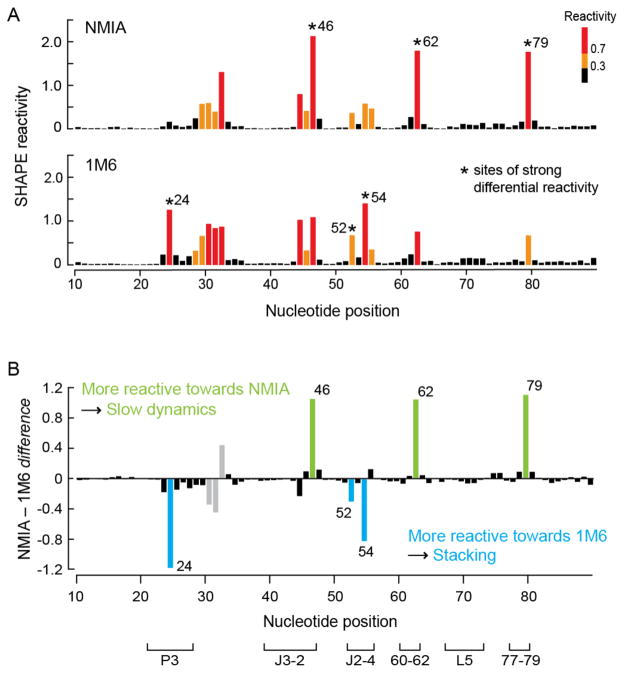
Figure 2.
SHAPE analysis of the ligand-bound state of the TPP riboswitch. (A) Absolute SHAPE reactivities resulting from reaction with NMIA (top) and 1M6 (bottom). Columns are colored by nucleotide reactivities. Asterisks indicate sites of strong differential reactivity. (B) Differential SHAPE reactivities calculated by subtracting the 1M6 profile from that of NMIA. Columns corresponding to nucleotides that exhibit statistically significant differential reactivity (absolute reactivity difference ≥ 0.3 SHAPE units and a p-value < 0.05, calculated using the Student’s t-test) are colored in green (for NMIA) and blue (for 1M6). Gray columns represent nucleotides with differential reactivity that are involved in crystal contacts or have poorly-defined electron density.

