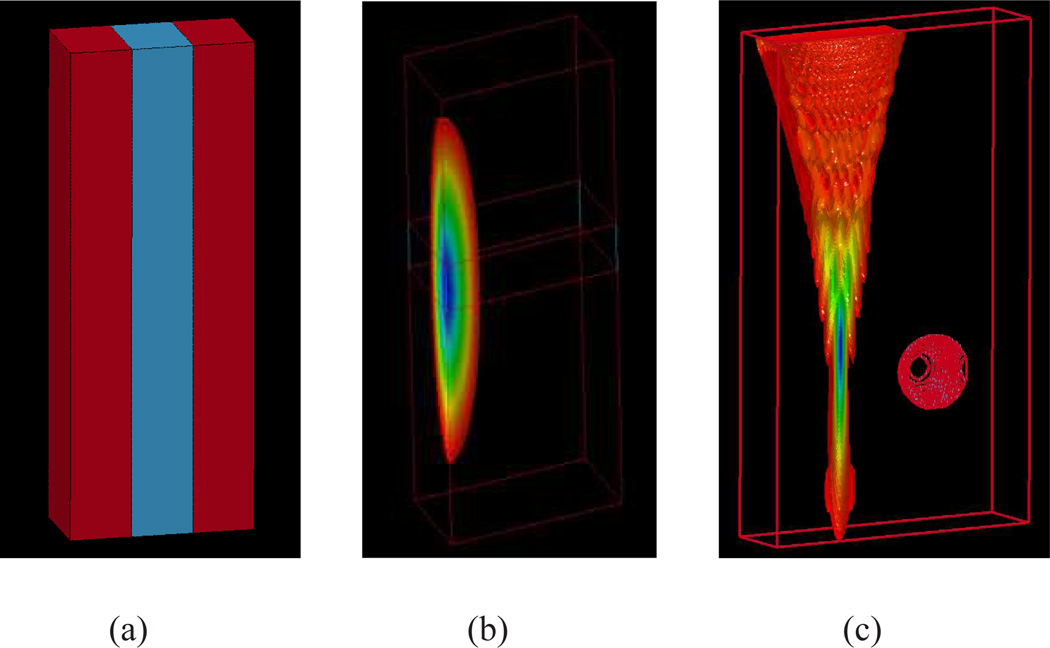
Fig. 1.
Illustration of the material and excitation configurations used in this investigation. (a) A stiff vertical layer (E = 20 kPa) with a thickness of 2–10 mm in a soft (E = 5 kPa) background. (b) An example Gaussian excitation used to image the layered models. (c) An example of the experimental excitation configuration described in Table I, that was used in the simulation of a stiff (E = 20 kPa) 10 mm diameter spherical lesion in a soft (E = 5 kPa) background.

