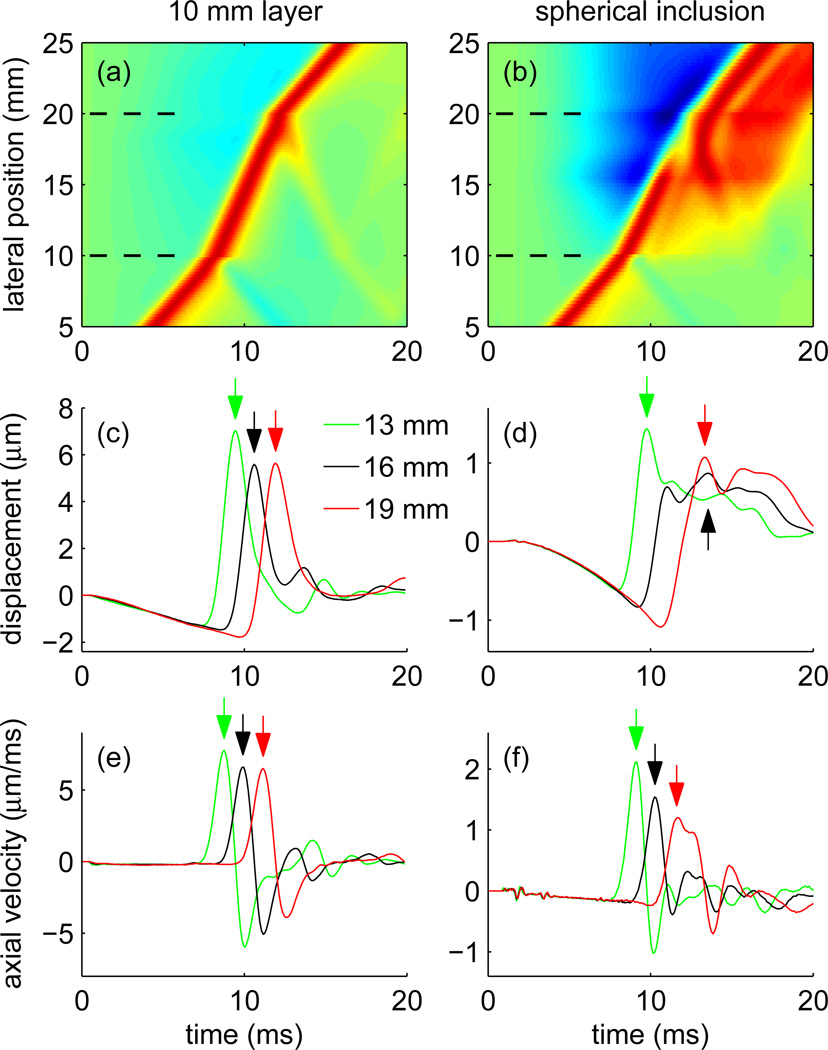
Fig. 2.
Simulated FEM displacement data resulting from excitations centered at a lateral position of 0 mm showing shear wave propagation across a 10 mm thick layer ((a),(c),(e)), and across the center of a 10 mm diameter spherical inclusion ((b),(d),(f)). For the 10 mm thick layer, a 1 mm wide Gaussian excitation was used and displacement data are shown at an depth equal to the axial center of the excitation. For the spherical inclusion, a simulated CH4-1 excitation was used and displacement data are shown at an axial position equal to the focal depth. Images (a) and (b) show displacement data for all lateral positions. These data have been normalized by dividing the displacement profile at each lateral position by its maximum displacement to help visualize the trajectory through the entire lateral range. The boundaries of the layer or sphere at 10 and 20 mm are indicated by dashed lines. Plots (c) and (d) show displacement vs. time profiles for specific lateral positions of 13 mm, 16 mm, and 19 mm. Plots (e) and (f) show axial velocities at the same lateral positions obtained by differentiation of the displacement profiles with respect to time. The arrows indicate the peak displacements ((c),(d)) and peak velocities ((e),(f)) corresponding to the wave arrival times determined using the TTP and TTPS methods.

