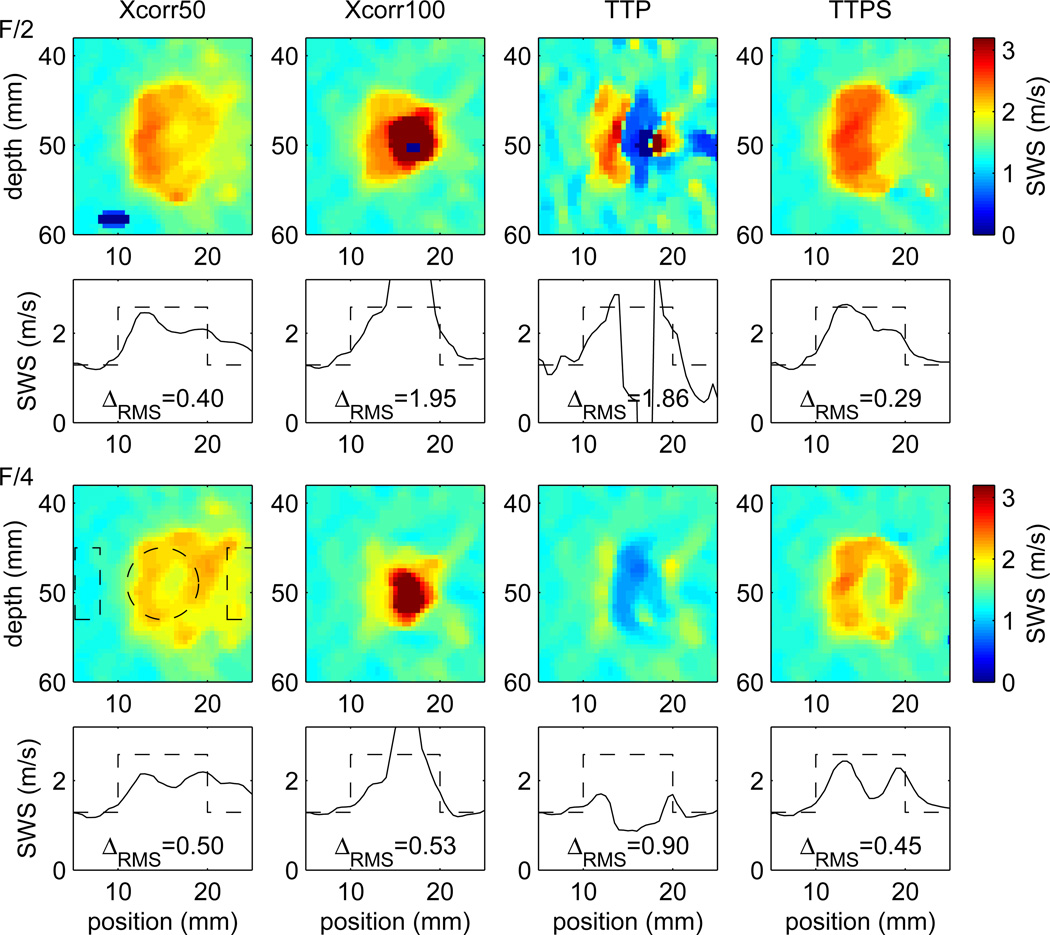
Fig. 8.
SWS images and lateral profiles at the focal depth of 49 mm for a tracked simulation of a 10 mm diameter, E = 20 kPa, spherical inclusion in a uniform background with E = 5 kPa. The pushing configurations used lateral F-numbers of F/2 (top two rows) and F/4 (bottom two rows) corresponding to beamwidths at the focal depth of 1.4 mm and 2.8 mm, respectively. The four columns show SWS reconstructions performed using the Xcorr50, Xcorr100, TTP, and TTPS methods to estimate the wave arrival time. Shear wave speeds were reconstructed using a 4 mm lateral kernel, and then smoothed using a 2 × 2 mm2 median filter. The reconstruction error ΔRMS is given (in units of m/s) for each case. For the eight images, contrast values calculated using (10) are (left to right) 0.46, 1.32, 0.34, 0.75 for the F/2 case, and 0.28, 0.98, 0.13, 0.49 for the F/4 case. Similarly, the CNR values calculated using (11) are 3.3, 1.2, 0.7, 6.4 for the F/2 case, and 1.9, 2.1, 0.8, 4.1 for the F/4 case. Regions used to calculate the contrast and CNR values are indicated by dashed lines on the F/4, Xcorr50 image.

