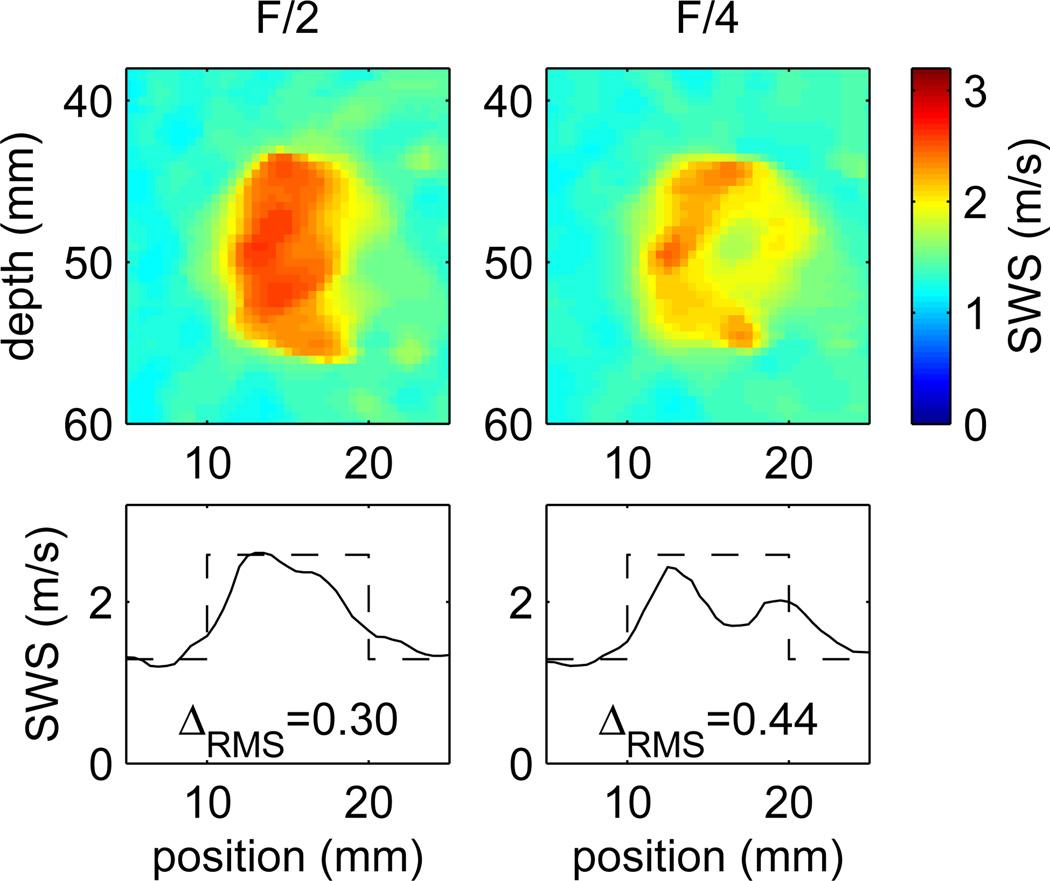
Fig. 9.
SWS images and lateral profiles obtained by including the directional filter described by Deffieux, et al. [23] in the reconstruction procedure for the same distribution of scatters and TTPS method to estimate the wave arrival time as shown in Fig. 8. Results are shown using the F/2 (left) and F/4 (right) excitation configurations. The reconstruction error ΔRMS is given (in units of m/s) on the figure. Values of contrast and CNR, calculated using the same regions as shown in Fig. 8. are 0.78 and 7.2 for the F/2 case, and 0.50 and 4.6 for the F/4 case, respectively.

