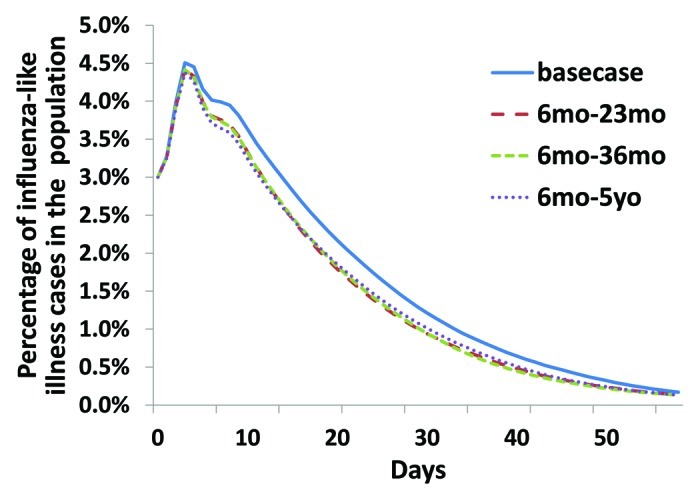
Figure 4.

Temporal evolution of the number of infected individuals. For the four different situations, we averaged epidemic curves over 1000 simulations. We can notice the impact of pediatric vaccination on the course of the epidemic. However our model is not able to differentiate the temporal impact of the different pediatric strategies over the period of time considered.
