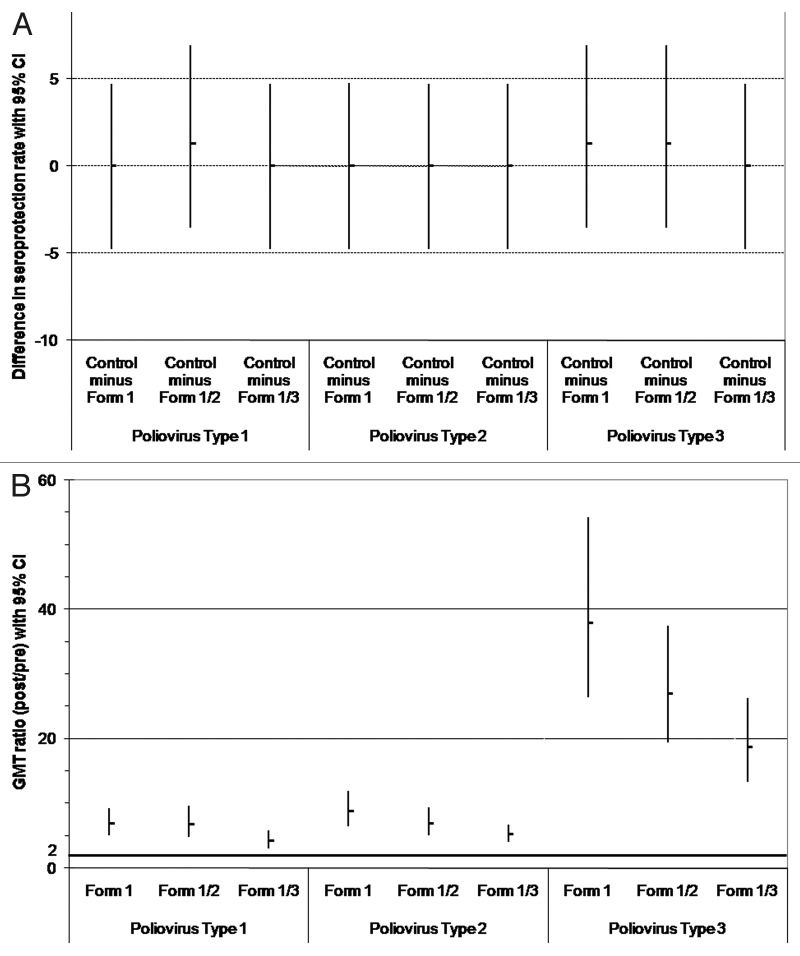
Figure 1.
Comparison between groups in the immune response to poliovirus types 1, 2 and 3 (ATP immunogenicity cohort): (A) difference in seroprotection rates between the control group and each DTPa-HBV-IPV/Hib formulation (Formulations 1–3); (B) GMT ratios (post divided by pre-vaccination titers) for anti-poliovirus types 1, 2 and 3. (A) The upper limits of the standardized asymptotic 95% CI on the group difference in the percentage of subjects with anti-poliovirus types 1, 2 and 3 titers ≥ 8 are ≤ 10 (predefined criteria for non-inferiority indicated by bold horizontal line); (B) The lower limits of the two-sided 95% CI on the geometric mean of the individual ratios (post- over pre-vaccination titers) for anti-poliovirus types 1, 2 and 3 antibodies are ≥ 2 (predefined criteria for immunogenicity indicated by bold horizontal line). Form 1 received DTPw-HBV-IPV(full dose)/Hib; Form 1/2 received DTPw-HBV-IPV(1/2 dose)/Hib; Form 1/3 received DTPw-HBV-IPV(1/3 dose)/Hib; Controls received DTPw-HBV/Hib Kft + IPV.

