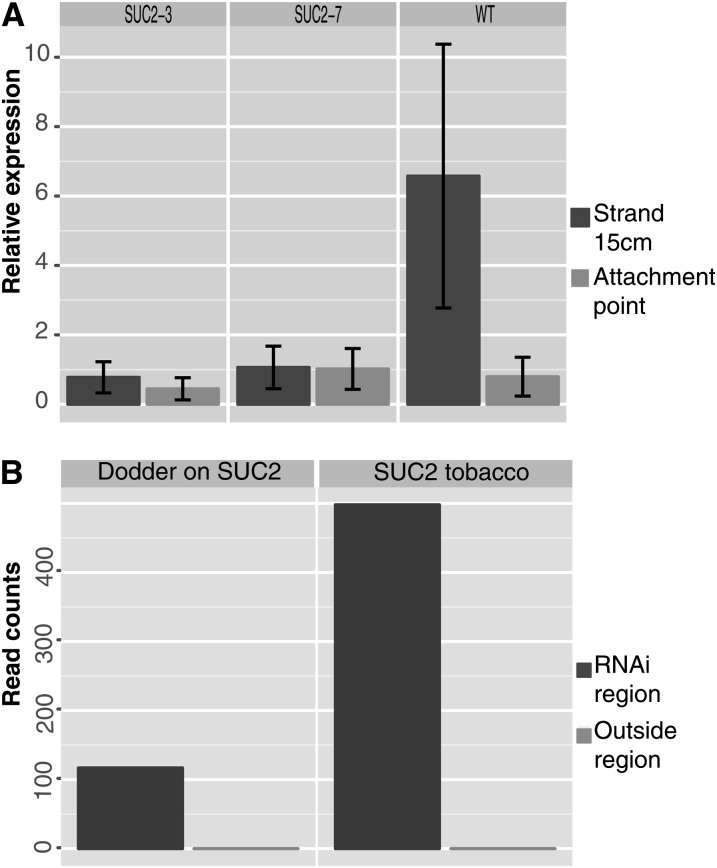
Figure 3.
STM Downregulation in Dodder.
(A) qRT-PCR showing reduced dodder STM expression in both attached and independent RNAi transgenic lines SUC2-3 and SUC2-7.
(B) Distribution of the reads across the STM gene fragment in the region targeted for RNAi and reads outside the targeted region. Raw read counts are shown here to visualize the distribution.

