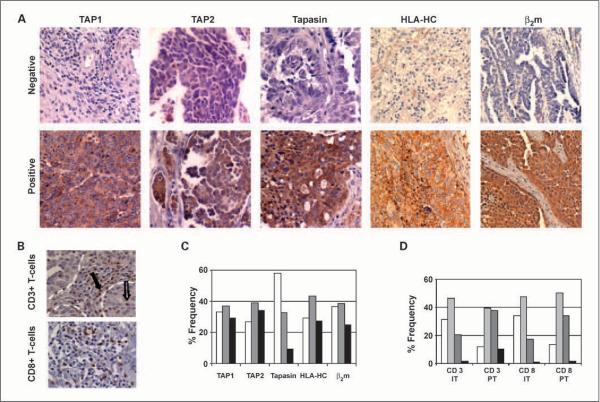
Fig. 1.
Representative staining pattern of APM components and T cells. A, staining patterns for negative versus positive (including heterogeneous) immunostaining in epithelial ovarian carcinoma. Original magnification, ×100. B, immunohistochemical staining patterns for positive CD3+ and CD8+ T cells. Solid arrow, CD3+ T cell in the peritumoral tissue; open arrow, intratumoral CD3+ T cell. Borders of tumor and stroma tissues are demarcated by white dotted lines. Original magnification, ×200. C, distribution of staining patterns for the various APM components in epithelial ovarian cancers. D, distribution of staining patterns for the CD3+/CD8+ T cells. IT, intratumoral; PT, peritumoral.

