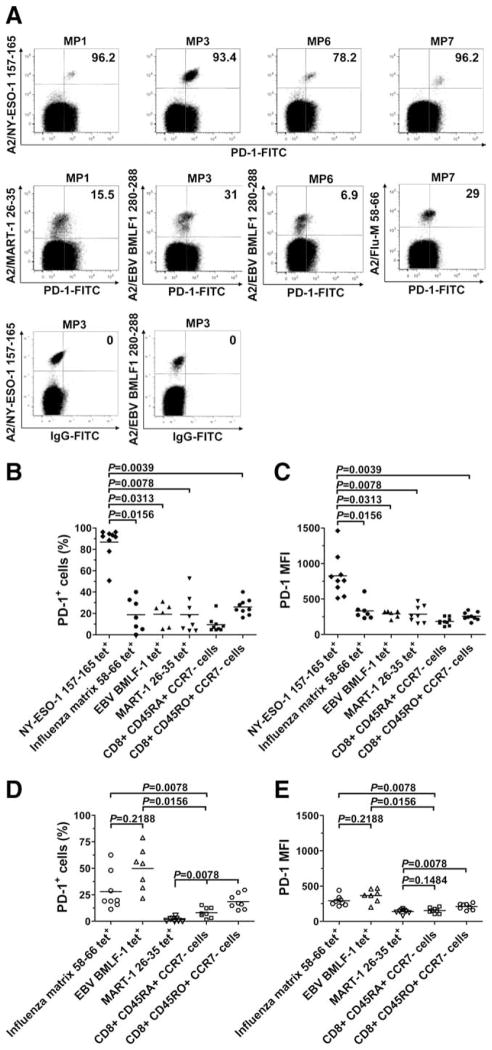
FIGURE 1.
PD-1 expression is up-regulated on NY-ESO-1-specific CD8+ T cells. A, Representative dot plots from different melanoma patients (MP) showing PD-1 expression on HLA-A2 (A2)/NY-ESO-1157–165 tet+, A2/EBV-BMLF1280–288, A2/Flu-M58–66, and A2/MART-126 –35 tet+CD8+ T cells (upper panels). Representative examples of NY-ESO-1 tet+ and EBV tet+CD8+ T cells stained with a FITC-labeled isotype IgG control Ab are also displayed and were used to establish the threshold for identifying PD-1+ cells (lower panel). Values indicate the percentage of CD8+ T cells expressing PD-1 among tet+ cells. B–E, Pooled data showing the percentage and MFI of PD-1 expression on NY-ESO-1-, Flu-, EBV-, and MART-1-specific as well as total effector (CD45RA+CCR7−) and effector memory (CD45RO+CCR7−) CD8+ T cells from nine melanoma patients (B and C) and eight healthy donors (D and E). Horizontal bars depict the mean percentage and MFI of PD-1 expression on tet+CD8+ T cells. The p values were calculated using the Wilcoxon signed rank test.

