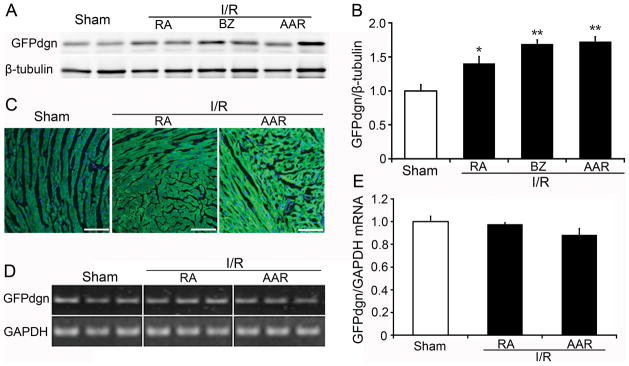
Figure 2. Increase of GFPdgn protein levels in GFPdgn tg mouse hearts after in vivo focal I/R.
A and B, Western blot analyses show increases in the myocardial GFPdgn protein level in the indicated zones (RA, BZ, and AAR) of the LV free wall after I/R. Representative images (A) and densitometry data (B) are presented. N=4 mice per group; *p<0.05, **p<0.01 vs. sham. C, Representative images of myocardial GFPdgn direct green fluorescence in the indicated zones of the LV. Nuclei were stained blue with DAPI. Scale bar=100μm. D and E, RT-PCR assays show that I/R did not increase GFPdgn mRNA levels in the area at risk and the remote area. N=6 mice/group.

