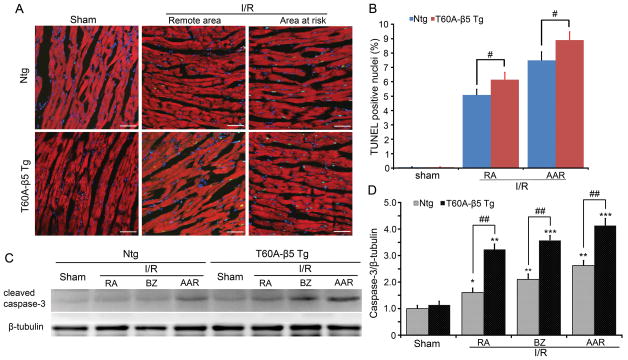
Figure 6. Evaluation of cardiomyocyte apoptosis in Ntg and T60A-β5 Tg mice undergone myocardial I/R.
A, Representative images of TUNEL staining (green) in the sham and the indicated zones of the LV of I/R hearts. Nuclei were stained blue with DAPI. Cardiomyocytes are identified by the green fluorescence resulting from Alexa-568-phalloidin staining. Scale bar=50μm. B, The number of TUNEL-positive nuclei is expressed as a percentage of total nuclei detected by DAPI staining. n=6 mice/group, *P<0.05 vs. Ntg. C and D, Western blot analysis myocardial levels of the cleaved (i.e., activated) caspase-3 in all zones of the T60A-β5 Ntg and Tg mouse hearts. N=4; *p< 0.05, **p<0.01, ***p<0.005 vs. Ntg sham; #p< 0.05, ##p<0.01.

