Figure 3.
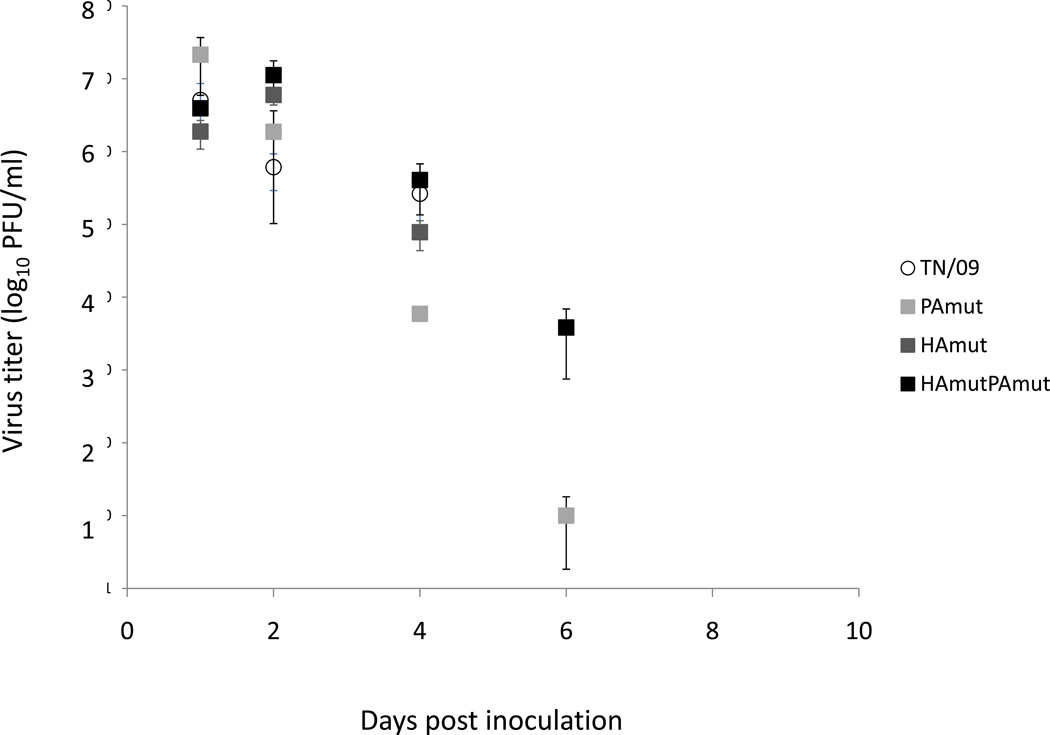
Ferrets’ virus titers in the upper respiratory tract (nasal washes) after infection with rg-A/Tennessee/560/09 (TN/09, open circles), rg-A/Tennessee/560/09-PA L295P mutant (PAmut, light gray squares), rg-A/Tennessee/560/09-HA K154Q mutant (HAmut, dark gray squares), and rg-A/Tennessee/560/09-HA K154Q mutant and PAL295P mutant (HAmutPAmut, black squares). Values are the mean ± SD for two ferrets (or three ferrets on days 1 and 2 post infection) and expressed as log10 PFU/ml. The limit of virus detection was 1 log10PFU/ml. For calculation of the mean, samples with a virus titer <1 log10PFU/ml were assigned a value of 0.

