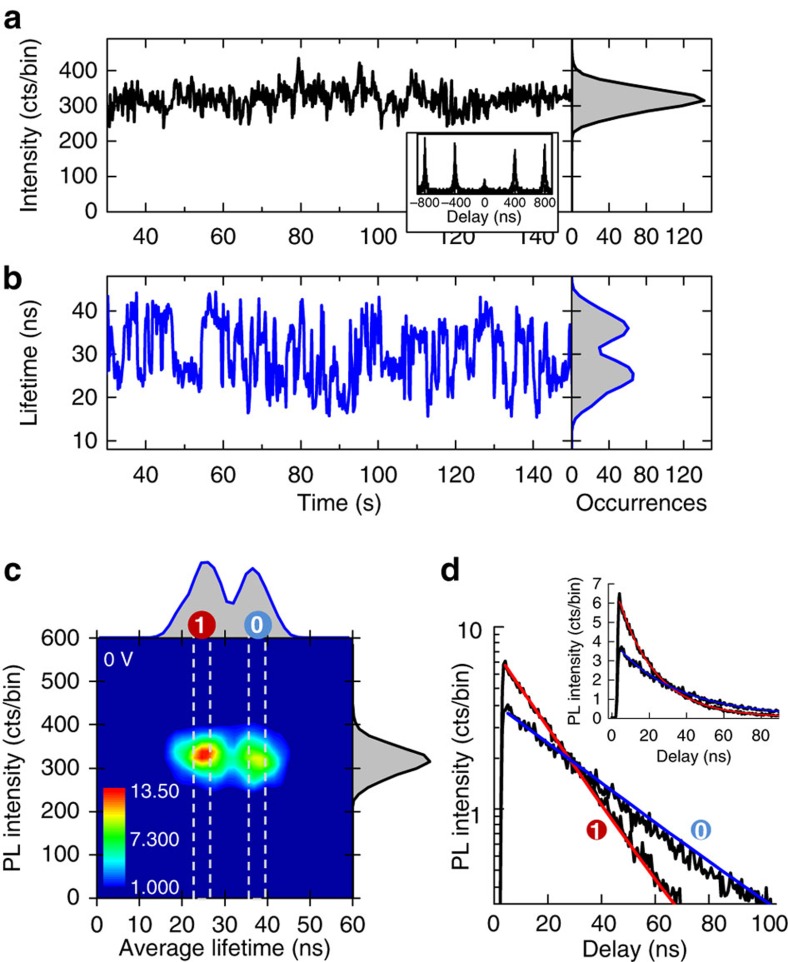
Figure 2. Discrete charge fluctuations in a single nonblinking NQD.
Time-tagged, time-resolved data from an individual NQD acquired at low fluence (the average NQD occupancy Nex~0.08) under zero electrochemical potential (0 V vs silver wire reference) and analysed with a time bin of 200 ms. (a) PL intensity and (b) average lifetime trajectories. The histograms obtained for the total experiment time of 180 s are also shown. Inset: autocorrelation function measured in a Hanbury Brown and Twiss configuration. The area of the central peak divided by the mean area of the side peaks yields g(2)(0)=0.1±0.01. (c) The corresponding FLID colour plot. The two-dimensional histogram was constructed with a 1-ns lifetime binning and a 15 counts intensity binning, smoothened by a two-point averaging. The colour scale represents the frequency of occurrences of given intensity-lifetime pairs. (d) The PL decay curves obtained by filtering the bins in windows (0) and (1) marked in (b) normalized to the total number of the selected bins. The blue and red curves show the mono-exponential fits with lifetimes 39 ns (0) and 19 ns (1), respectively. The inset is the same plot but on a linear scale to show more clearly the factor of ~2 difference between the early time PL amplitudes, as expected for the neutral and singly-charged exciton states.

