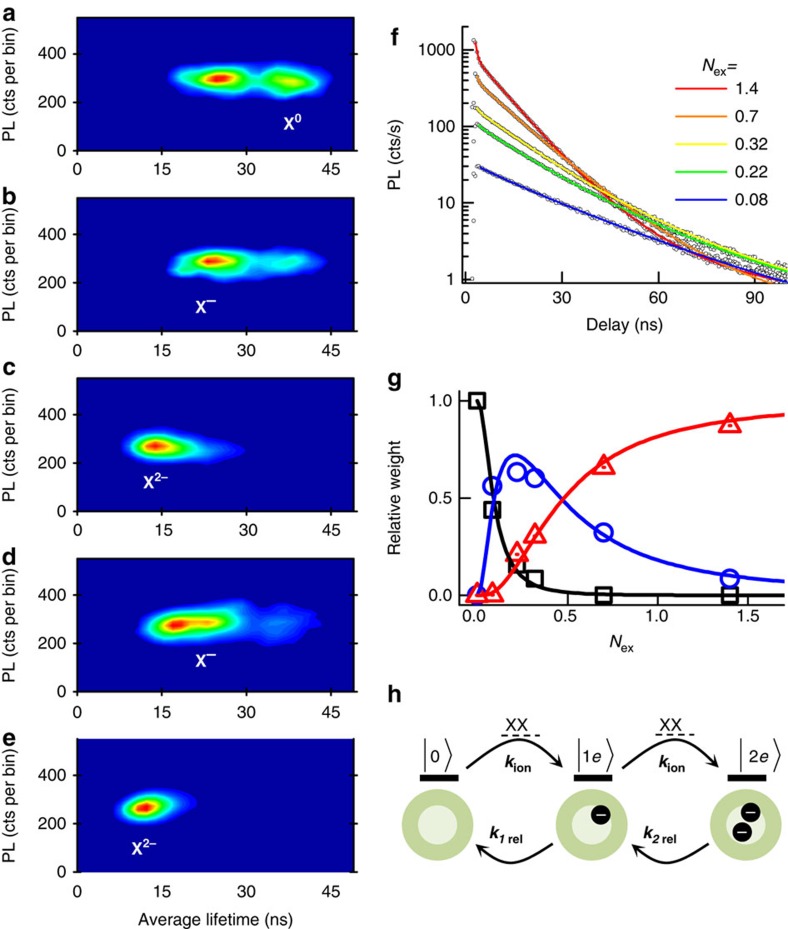
Figure 3. Electrochemical and photoinduced charging of a single NQD. Data are from the same NQD used earlier.
(a–c) FLIDs under increasing negative potential (electron injection) and constant fluence (Nex~0.08): (a) 0 V; (b) −0.5 V; and (c) −0.8 V. Bin size is 200 ms. (d,e) The potential is kept at zero but the fluence is increased: (d) Nex~0.22 (bin size 80 ms); (e) Nex~0.7 (bin size 30 ms). (f) PL decay curves acquired over 180 s under increasing fluence (open circles) and fits using a global fitting procedure described in the text (solid lines). (g) Open symbols: relative weights of emission from the neutral exciton (black squares), singly (blue circles) and doubly (red triangles) charged excitons extracted from the global fit parameters. Solid lines: simulated average populations for a neutral (black), singly (blue) and doubly (red) charged NQD states obtained using the model. (h) Schematics of the model for photoinduced charging. XX represents the creation of a biexciton on laser excitation, which can lead to Auger photoionization and charging of the nanocrystal with rate kion. A singly charged dot (state 1e) and a doubly charged dot (state 2e) relax by losing an electron with rates k1 rel and k2 rel, respectively.

