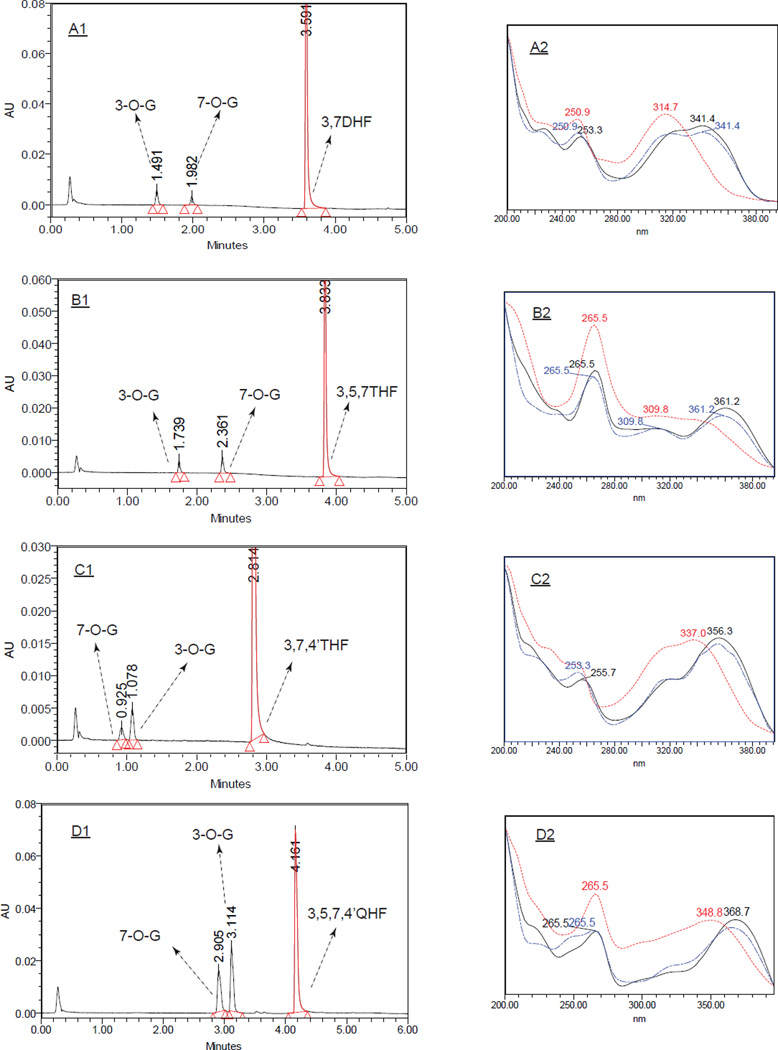
Figure.2.
Representative UPLC chromatograms (left) and UV spectra (right) of flavonols and their 3-O- / 7-O-glucuronides. A - D panels represent 3,7DHF, 3,5,7THF, 3,7,4’THF and 3,5,7,4’-QHF and their 3-O- / 7-O-glucuronides, respectively. UPLC samples were from enzyme assays in which the respective 10 µM flaonovls were incubated with 27.5 µg/ml UGT1A9 for 10 or 60 mins. For spectra, (black) solid line denotes the flavonols; (red) dotted lines are 3-O-glucuronides; (blue) dash-dotted lines are 7-O-glucuronides. Comparing to the parent compounds, band I of 3-O-glucuronides either disappeared or resulted in large hypsochromic shifts (to shorter wavelengths) (e.g. 19.3~26.7 nm). In contrast, 7-O-glucuornides caused minimal (<2 nm) or no changes in the UV spectrum (25).

