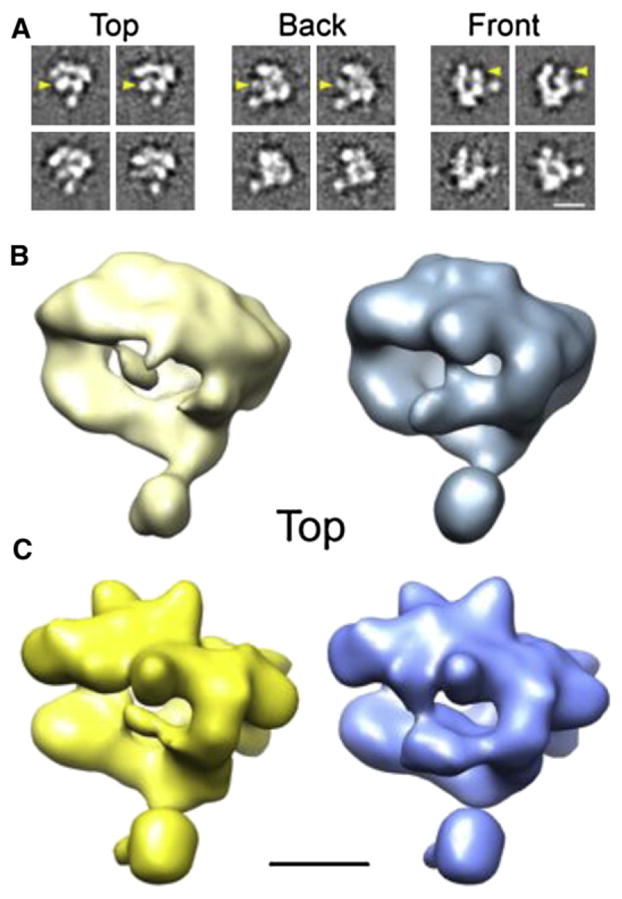
Figure 5. Conformational Variability of hRNAPII Revealed by ISAC Cluster Averages.

(A) Selected hRNAPII ISAC averages showing changes in the position/ appearance of the clamp domain (marked by yellow arrowheads).
(B) hRNAPII volumes obtained after CD-PCA analysis of resampled ISAC averages show variability in clamp structure.
(C) Two 3D maps obtained by competitive refinement of hRNAPII images using the volumes in (B) as initial references show alternative conformations of the hRNAPII clamp domain. Scale bars correspond to 10 nm in (A) and 5 nm in (B and C).
