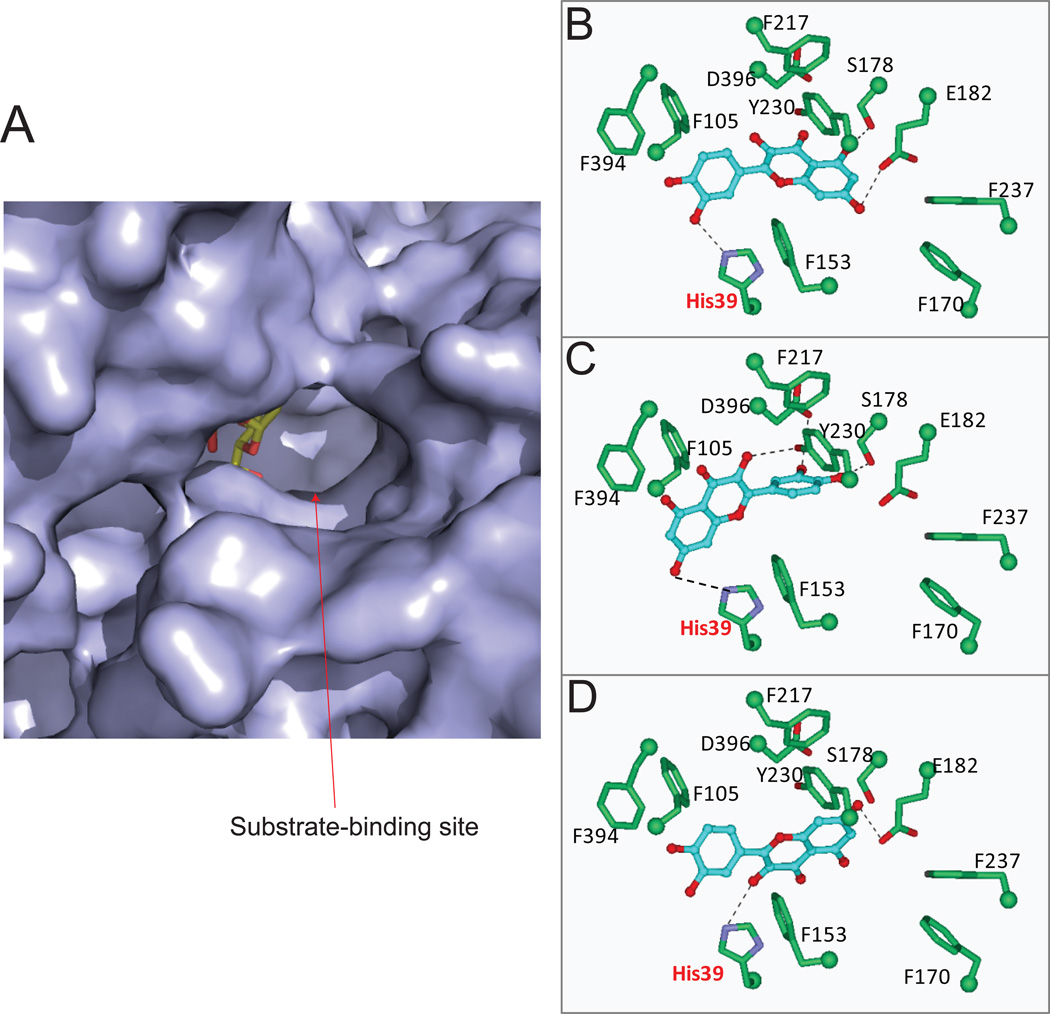
Figure.8. The substrate binding pocket of human UGT1A1 (homology model) and its interaction with quercetin.
Panel A: Molecular surface diagram of the substrate binding pocket. The copied UDP-glucose is shown as stick models. Panel B–D, stereo diagrams showing interactions between quercetin in distinct (and regioselective) catalytic modes (panel B, 3’-OH; panel C, 7-OH, panel D, 3-OH) and side chains in the substrate-binding pocket. Dashed lines indicate potential hydrogen bonds.

