Figure 4.

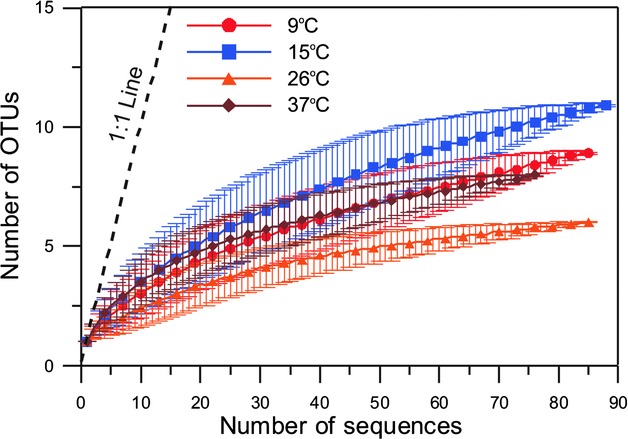
Rarefaction curves at 98% sequence similarity level for 9°C, 15°C, 26°C, and 37°C samples after 10 days of incubation. Error bars indicate 95% confidence intervals. For clarity, every third sample was plotted.

Rarefaction curves at 98% sequence similarity level for 9°C, 15°C, 26°C, and 37°C samples after 10 days of incubation. Error bars indicate 95% confidence intervals. For clarity, every third sample was plotted.