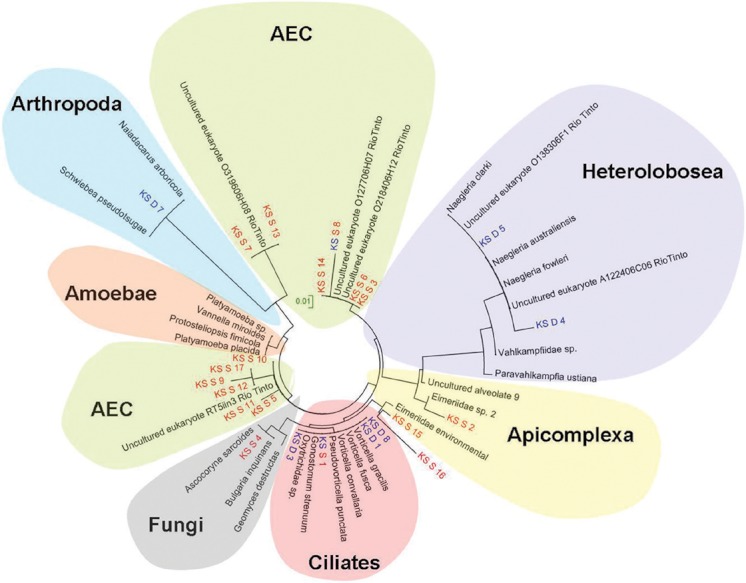
Figure 4.

Phylogenetic tree based on minimum-evolution analysis of 18S ribosomal RNAs using neighbor-joining evolutionary distance model. Clones (OTUs) retrieved from the acid streamer biofilms were denoted as KS_D and are shown in blue, and clones (OTUs) from the stalactite biofilms are labeled as KS_S and are shown in red. Clones (OTUs) appearing in blue and red were identified in both types of biofilms. The scale bar corresponds to a distance of one substitution per 100 nucleotide positions.
