Figure 2.

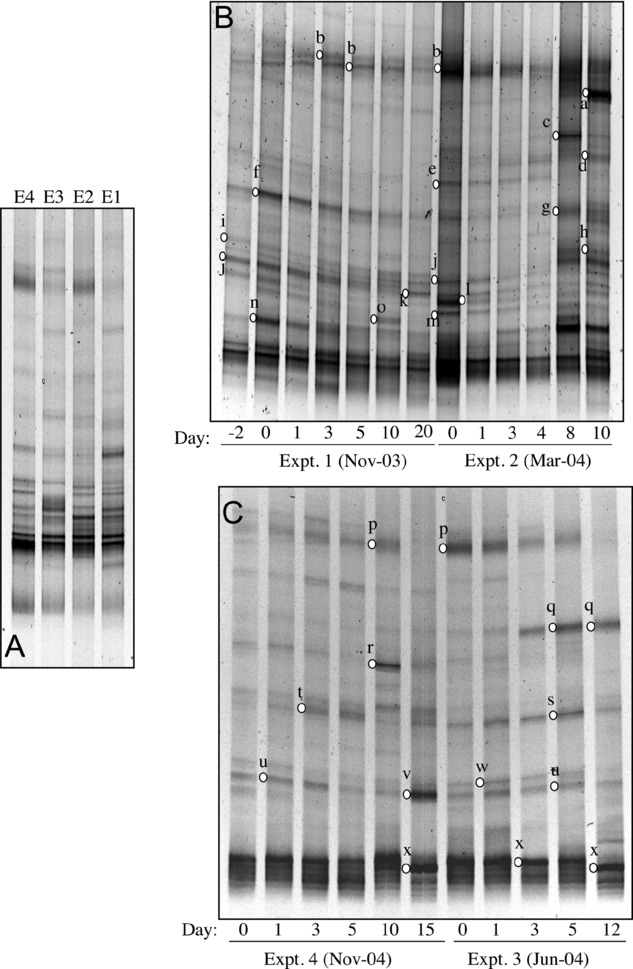
DGGE fingerprints of bacterial assemblages visualized by DGGE of PCR-amplified partial 16S rRNA genes from the initial time zero samples of the four experiments (A), during experiments 1 and 2 (B), and 3 and 4 (C).

DGGE fingerprints of bacterial assemblages visualized by DGGE of PCR-amplified partial 16S rRNA genes from the initial time zero samples of the four experiments (A), during experiments 1 and 2 (B), and 3 and 4 (C).