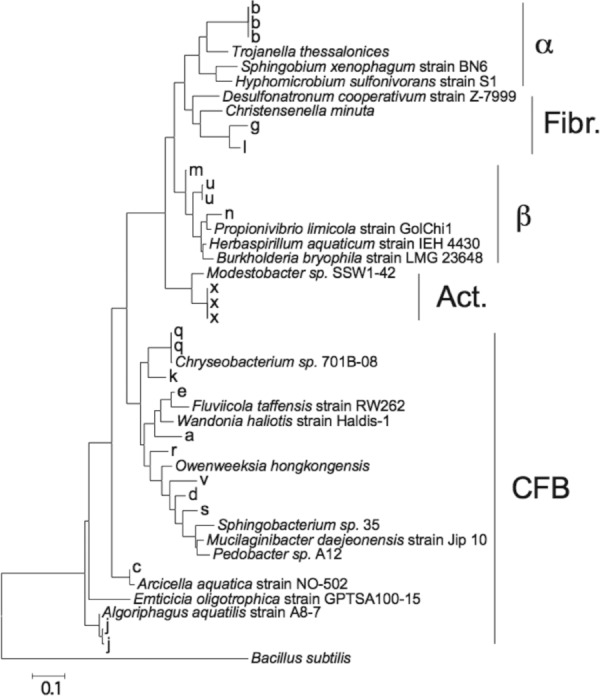
Figure 4.

Phylogenetic tree depicting relationships among partial 16S rRNA gene sequences of bacterial phylotypes detected during the four experiments (shown in letters according to Table 2) compared to type species of representative genera in the different phylums. Scale bar depicts 0.1 substitution per nucleotide position. Fibr., Fibrobacteres; Act., Actinobacteria; CFB, Bacteroidetes.
