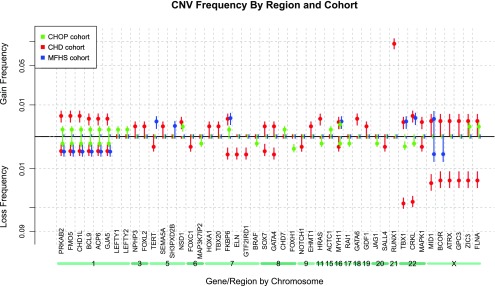
Fig. 4.
CNV frequency spectrum. Note that any gene showing 0% CNV frequency in all 3 cohorts was omitted from this figure due to space considerations. Vertical error bars drawn represent 1 SD from the mean in the estimated sampling distribution. From this visualization it is clear that gains over gene FKBP6 on chromosome 7 occur in all 3 cohorts, while losses of the same gene are only seen in the CHD cohort, implying a loss could cause CHD.

