
Fig. 6.
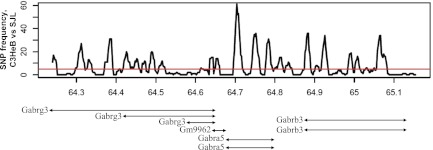
Analysis of QTL regions that are identical by descent. Peaks above the red line indicate high probability of SNP variation between strains. SJL mice are genetically distinct from C3HeB. A threshold of SNP frequency was 5.
Official websites use .gov
A
.gov website belongs to an official
government organization in the United States.
Secure .gov websites use HTTPS
A lock (
) or https:// means you've safely
connected to the .gov website. Share sensitive
information only on official, secure websites.
Analysis of QTL regions that are identical by descent. Peaks above the red line indicate high probability of SNP variation between strains. SJL mice are genetically distinct from C3HeB. A threshold of SNP frequency was 5.