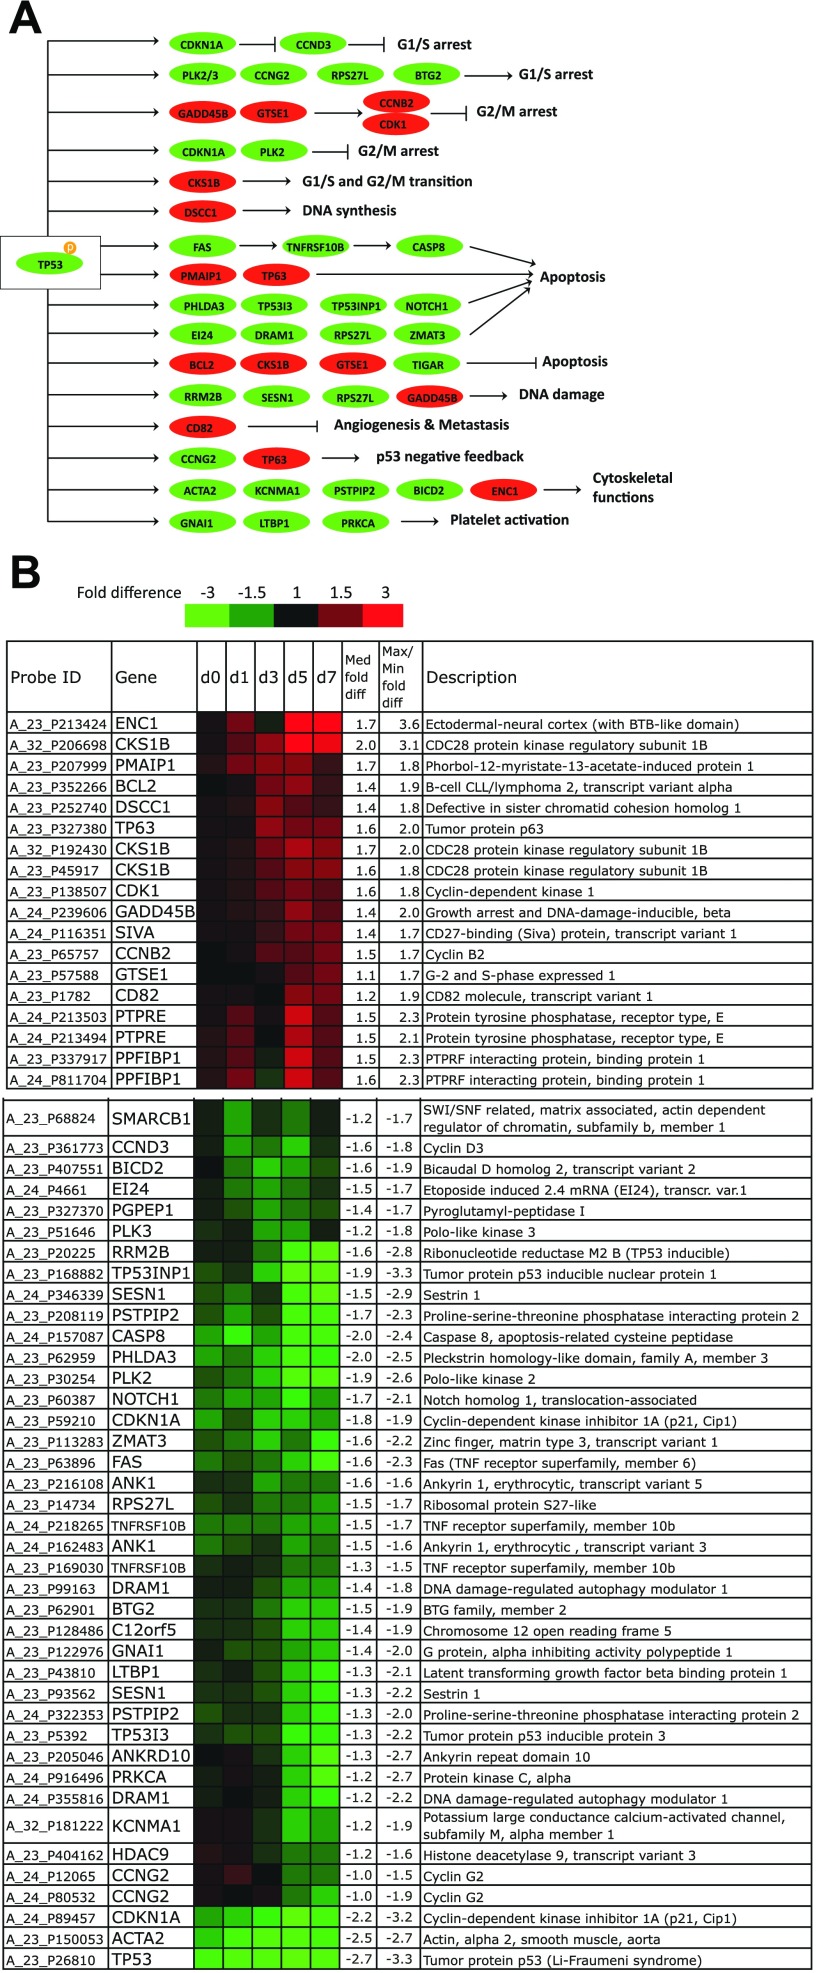
Fig. 5.
Differentially expressed p53 target genes. A: mapping of differentially expressed p53 target genes to known functions. Red, upregulated; green, downregulated. The figure was modified from the KEGG p53 signaling pathway by including recently discovered p53 targets. B: highly upregulated p53 targets in p53-knock-down (KD) CHRF cells and highly downregulated p53 targets in p53-KD CHRF cells relative to control CHRF cells. Rows show the probe ID on the Agilent 4 × 44K whole human genome microarray, expression ratios between p53-KD, and control CHRF cells on day 0 (unstimulated) and days 1, 3, 5, and 7 after PMA stimulation, the gene name, median, and maximal/minimal fold difference, and gene description. Saturated red indicates 3-fold upregulation in p53-KD cells relative to control cells, while saturated green indicates 3-fold downregulation in p53-KD cells relative to control cells. p53-KD and control CHRF cells were either unstimulated or treated with 10 ng/ml PMA. Experiments 1 and 2 are averaged.

