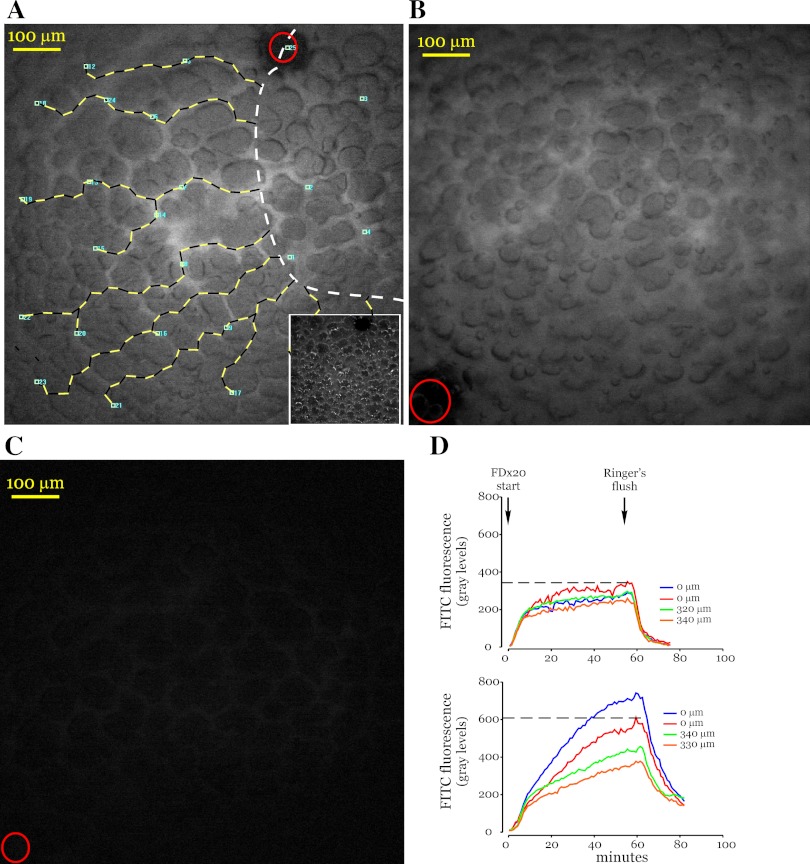
Fig. 2.
Vascular infusion of FITC-dextran. A: image shows peak FITC-dextran 20 kDa (FDx20) fluorescence in a lung microvascular network. Small blue squares (5 μm × 5 μm) were randomly placed fluorescence sampling sites on microvessels. Numbers next to the squares identify measurement sites. Microvessels were identified by using both the fluorescence image and the corresponding bright-field image (inset). No microvessel had more than 1 sampling site. The lines with alternating black and yellow segments were drawn along vessels from the outer boundary of the acid-instilled region (dashed white line) to the fluorescence measurement sites and provide distance information. Both black and yellow segments are 20 μm each, with shorter 10-μm segments interspersed as needed. Note that only a part of the acid-instilled region lies within the image. Red circle indicates site of oil drop marker. B and C: images show residual FDx20 fluorescence following 10 min of Ringer's wash in acid- (B) and saline- (C) instilled lungs. Red circles in images show site of oil drop marker. D: graphs show changes in FDx20 fluorescence for multiple measurement sites. The 0-μm tracings are fluorescence data from measurement sites that lie within the acid-instilled regions, and others are from sites at the indicated distances from the outer boundary of the acid-instilled region. Top, saline instillation; bottom, acid instillation. Dashed lines are representative and mark peak fluorescence for red 0-μm tracings only.

