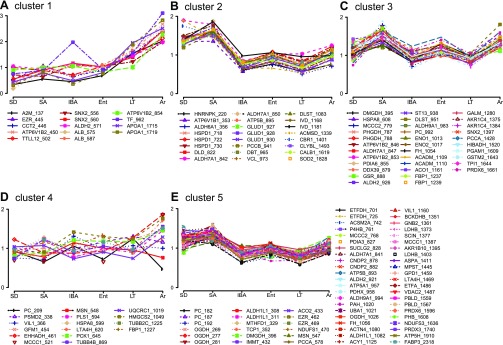
Fig. 4.
K-means clustering of protein abundance changes. Five clusters containing the 150 uniquely identified protein spots: cluster 1, n = 14 (A); cluster 2, n = 24 (B); cluster 3, n = 34 (C); cluster 4, n = 16 (D), and cluster 5, n = 62 spots (E). Mean values for each state are plotted. The top 7 RF classifying proteins from Fig. 3C are found in clusters 1 (APOA1 and ALB), 3 (DLST), and 5 (IMMT, ASPA, and GNB2).

