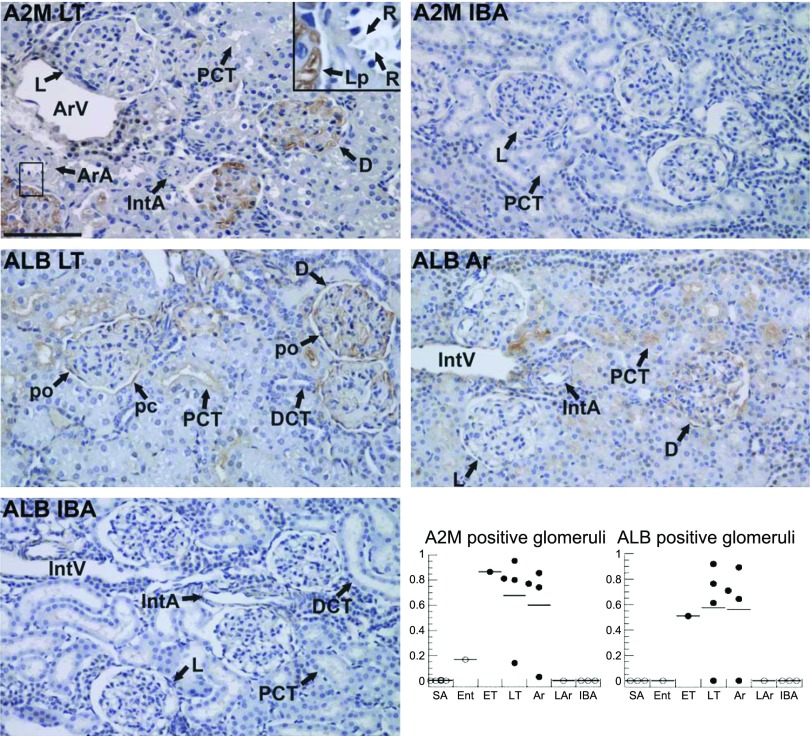
Fig. 7.
Localization of plasma proteins and visualization of their dynamics in kidney during torpor-arousal cycles by immunohistochemistry. Micrographs show representative sections of renal cortex from the indicated hibernation stage (Fig. 1) stained with antibodies to α2-macroglobulin (A2M) or ALB. All sections were counterstained with hematoxylin and imaged at the same magnification; the scale bar in top left panel indicates 100 μm. D and L point to dark and light-staining glomeruli, respectively; Ar A, afferent arteriole; DCT, distal convoluted tubule; Int A, interlobular artery; IntV, interlobular vein; Lp, glomerular capillary loop; pc, parietal cell; PCT, proximal convoluted tubule; po, podocyte; R, red blood cell. Graphs plot the fraction of glomeruli stained with the indicated antibody from different individuals from 7 stages (Fig. 1); the line marks the mean for each group. Significant differences among stages for the proportion of glomeruli stained were found for both A2M and ALB (P = 0.004 and 0.04 respectively; significant pairwise differences for A2M were found between LT and Ar, SA and IBA in addition to Ar and SA). Testing for temperature dependence by grouping all samples with Tb > 18°C (“warm” includes SA, Ent, LAr and IBA, n = 8 for ALB and n = 10 for A2M, ○) and those with Tb < 13°C (“cold,” includes ET, LT, Ar, n = 9, ●), finds significant differences based on Tb for both A2M (P = 0.0004) and ALB (P = 0.001).

