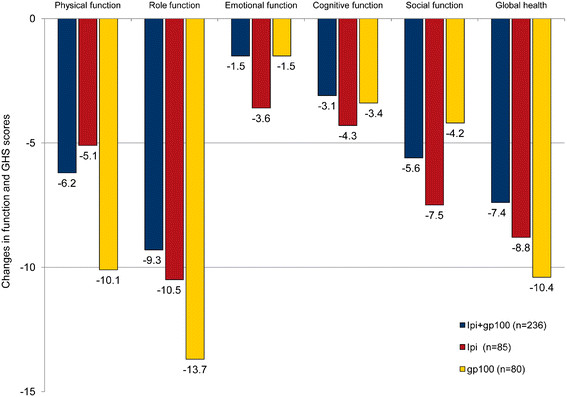
Figure 1.
Baseline to Week 12 endpoint changes in EORTC QLQ-C30 function and global health status scores. * For the functioning and global health scales, improvements are indicated by positive scores. ** p > 0.05 for all comparisons. Mean change in scores were categorized as “no change” (0–5), “a little” (5–10 points), “moderate” (10–20 points), and “very much” (>20).

