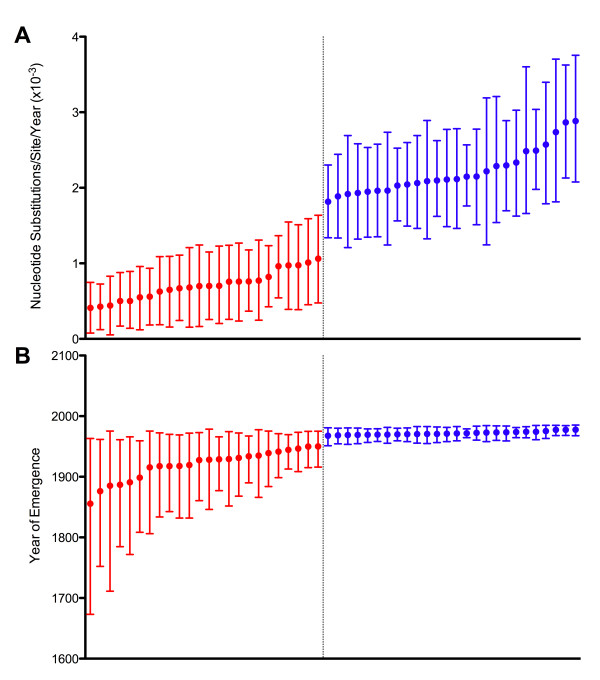
Figure 3.
RHDV nucleotide substitution rates (A) and years of emergence (B) estimated from the VP60 jackknife datasets. Mean substitution rates are shown with 95% HPD intervals for each of the 50 datasets of 30 random taxa. Estimates produced from datasets that included AY269825 are shown in red, while datasets that did not include AY269825 are shown in blue.

